library(EnhancedVolcano)
library(dplyr)Volcano
Volcano
Alex Emmons, Ph.D.
2024-01-17
Volcano Quarto Demonstration
Here we will create a volcano plot from differential expression results.
Tip
Labels are ensembl IDs. For a more useful figure, add an annotation step.
Learn more about Volcano plots here.
Create a Volcano Plot from DESeq2 differential expression results
Load the libraries
In [2]:
Load the data from command line arguments
The data were filtered to remove adjusted p-values that were NA; these were genes excluded by DESeq2 as a part of independent filtering.
In [4]:
data<-read.csv(params$data,row.names=1) %>% filter(!is.na(padj))Plot
Create label subsets for plotting.
In [6]:
labs<-head(row.names(data),5)Figure 1 allows us to identify which genes are statistically significant with large fold changes.
In [8]:
EnhancedVolcano(data,
                title = "Enhanced Volcano with Airways",
                lab = rownames(data),
                selectLab=labs,
                labSize=3,
                drawConnectors = TRUE,
                x = 'log2FoldChange',
y = 'padj') 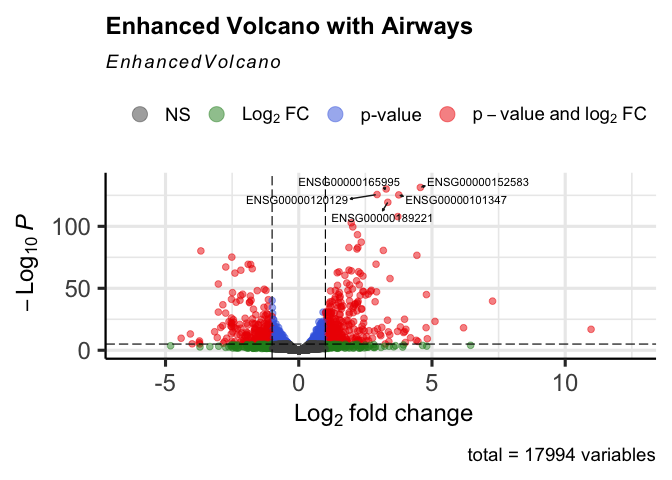
Other files in this working directory:
In [10]:
lsGettingStarted_with_Quarto.html
GettingStarted_with_Quarto.html.md
GettingStarted_with_Quarto.qmd
GettingStarted_with_Quarto_files
GettingStarted_with_Quarto_mkdocs.md
GettingStarted_with_Quarto_orig.html
Volcano_example.embed-preview.html
Volcano_example.embed_files
Volcano_example.html
Volcano_example.qmd
Volcano_example.rmarkdown
Volcano_example_files
deseq2_DEGs.csv
images