Here we will create a volcano plot from differential expression results.
A volcano plot is a type of scatter plot commonly used in RNA-Seq analysis to examine genes that may demonstrate biological significance. Log-fold change in expression is plotted on the x-axis and statistical significance is plotted on the y-axis. Learn more about Volcano plots here.
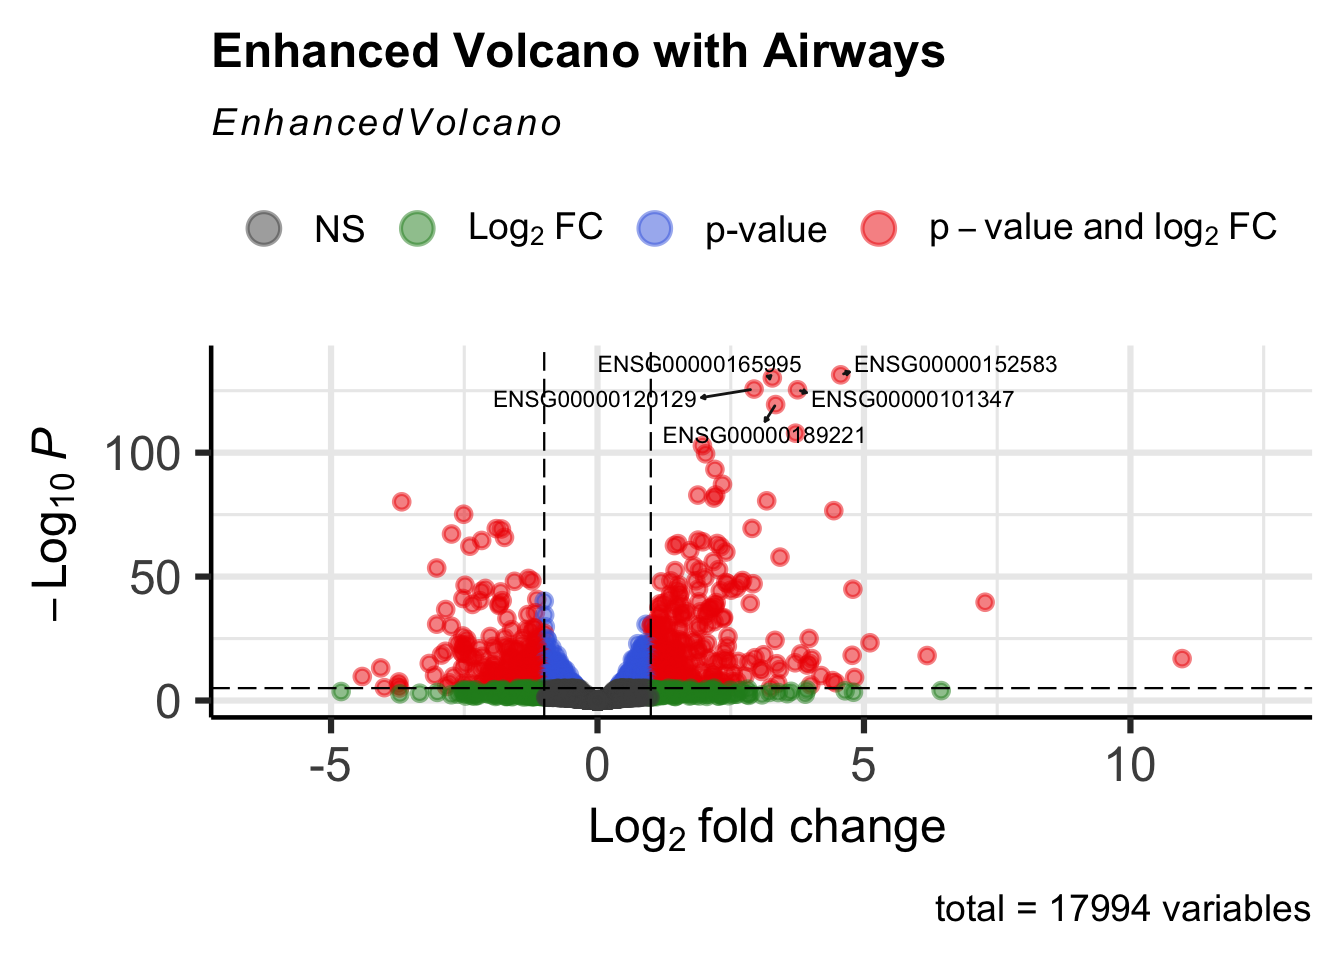
Note: In the following plot, labels are Ensembl IDs. For a more useful figure, consider adding an annotation step.
Create a Volcano Plot from DESeq2 differential expression results
Load the libraries
library(EnhancedVolcano)
Warning: package 'EnhancedVolcano' was built under R version 4.5.2
Loading required package: ggplot2
Warning: package 'ggplot2' was built under R version 4.5.2
Loading required package: ggrepel
library(dplyr)
Warning: package 'dplyr' was built under R version 4.5.2
Attaching package: 'dplyr'
The following objects are masked from 'package:stats':

    filter, lag
The following objects are masked from 'package:base':

    intersect, setdiff, setequal, union
Load the data from command line arguments
The data were filtered to remove adjusted p-values that were NA; these were genes excluded by DESeq2 as a part of independent filtering.
Figure 1 allows us to identify which genes are statistically significant with large fold changes.
EnhancedVolcano(data,title ="Enhanced Volcano with Airways",lab =rownames(data),selectLab=labs,labSize=3,drawConnectors =TRUE,x ='log2FoldChange',y ='padj')
Warning: Using `size` aesthetic for lines was deprecated in ggplot2 3.4.0.
ℹ Please use `linewidth` instead.
ℹ The deprecated feature was likely used in the EnhancedVolcano package.
  Please report the issue to the authors.
Warning: The `size` argument of `element_line()` is deprecated as of ggplot2 3.4.0.
ℹ Please use the `linewidth` argument instead.
ℹ The deprecated feature was likely used in the EnhancedVolcano package.
  Please report the issue to the authors.