Documenting Your Data Analysis with Quarto
Learning Objectives
- Understand how Quarto and similar tools can benefit you
- Get to know the reporting capabilities of Quarto
- Learn Quarto syntax and formats
- Learn how to get started using Quarto
This lesson does not include a comprehensive introduction to markdown syntax and formatting.
What is Quarto?
Quarto® is an open-source scientific and technical publishing system built on Pandoc —https://quarto.org/
What does this mean? Quarto allows you to combine code, commentary, and other features to tell a story about your data or data analysis using articles, presentations, dashboards, websites, blogs, or books. Click here for a list of supported Pandoc output formats.
This tutorial was rendered first with Quarto. The resulting markdown file was then used to add this tutorial to our existing BTEP Coding Club documentation.
Quarto is
- the next generation of RMarkdown brought to you by Posit.
- NOT an R package but rather instead a command line tool
Quarto is the format of a book or pamphlet produced from full sheets printed with eight pages of text, four to a side, then folded twice to produce four leaves. The earliest known European printed book is a Quarto, the Sibyllenbuch, believed to have been printed by Johannes Gutenberg in 1452–53. — Performing Magic with Quarto, Tom Mock
Why do we care about report generation?
Reproducibility and reusability in data management
Reproducibility in science means being able to generate the same experimental / analytical results with a high degree of reliability. This is necessary for research validation, scientific and public trust, innovation, and collaboration.
Reproducibility is not possible without complete transparency and exceptional documentation of all research steps (i.e., from the lab bench to the computer).
On the other hand, reusability refers to the reuse of data, methods, or workflows either for validation or new purposes. Reusability is important for applying methods to new problems, standardizing methodologies, and advancing discovery.
Reusability is also not possible without exceptional documentation.
Data management and reproducibility at NIH
NIH encourages data management and sharing practices to be consistent with the FAIR (Findable, Accessible, Interoperable, and Reusable) data principles. —sharing.nih.gov
The fair principles not only apply to data but also the algorithms, tools, and workflows that led to that data.
Effective January 25, 2023, the NIH released the 2023 NIH Data Management and Sharing Policy. This policy requires that NIH intramural researchers plan for data management and sharing prior to conducting scientific research. To do this, scientists are required to submit a Data Management and Sharing plan and comply with the approved plan. While the policy highlights types of data that should be managed and shared and provides links to further resources, it does not provide any guidance on the management and sharing of code needed to truly replicate an analysis.
Learn more about keeping your data FAIR here.
Why use Quarto?
We can make our research more reproducible and our data and methods more reusable by documenting, documenting, and documenting more…along with other steps (e.g., version control, containerization, etc.).
Quarto helps us document our data analysis. It is a tool for scientific communication! It was designed to be used
- For communicating to decision-makers
- For collaborating with other data scientists (including future you!)
- As an environment in which to do data science (a modern-day [eletronic] lab notebook) — R4DS
Quarto helps you tell others exactly what you did and how you derived your conclusions - code, results, and conclusions wrapped up in a single document. The use of Quarto and other publishing systems make our data analysis more reproducible.
Get started with Quarto at the beginning of a project. If you document as you go, you are much more likely to actually document your analysis.
Other report generators
Quarto is not the only game in town. You may be familiar with
- RMarkdown
- JupyterLab or notebook
- Google collab
If you are already invested in one of these, you may want to stick with it. However, if you are just getting started with documenting your data analyses and / or you are working on a highly collaborative project, Quarto is a good choice.
Quarto can render most RMarkdown (.Rmd) and Jupyter notebook files (.ipynb) out of the box. No edits necessary. This makes it an excellent tool for collaboration.
For circumstances that require preprocessing of jupyter notebooks for use with Quarto, there are notebook filters.
Advantages of Quarto
- Can use with the IDE or editor of your choice: Visual Studio Code, RStudio, JupyterLab/Jupyter notebook, other.
- Does not require R / RStudio.
- Can use directly from the command line.
- Language agnostic; can use the language of your choice (R, python, Julia, Bash, Observable) and can mix languages in a single document (R, Python, Bash, Observable).
- Easy to share with collaborators who prefer a different language or for mixed language projects.
- Better defaults; consistent syntax and approach across languages.
- Similar to RMarkdown but with fewer dependencies, greater consistency, and more flexibility.
R is executed using the knitr engine. Python and Julia are executed using the Jupyter engine. Bash can be executed using either. R and python can be mixed within the same document using the reticulate package and the knitr engine.
Gallery of examples
Let’s check out some examples.
The Quarto gallery includes many examples of various documentation types. Click on the link to explore more!
Getting Started
When rendering a Quarto document (.qmd file), the code blocks are processed using either knitr or jupyter, which is converted to markdown. That markdown is then converted to the final format using pandoc.

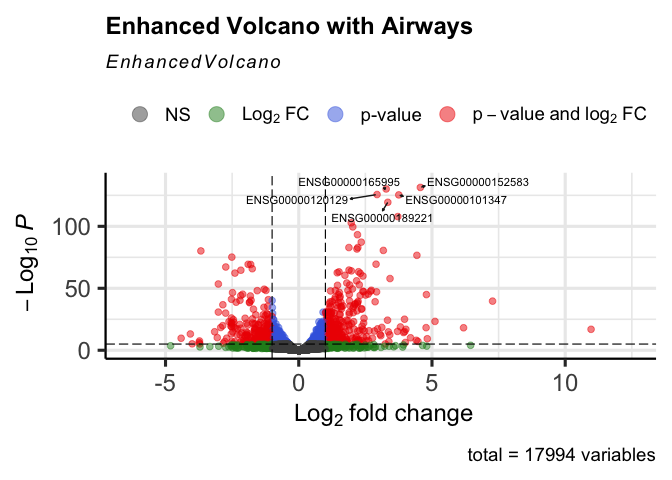
Let’s see how Quarto works. In this example, we will make a volcano plot using differential expression data.
Markdown Basics
Quarto uses markdown for formatting text, images, links, code, and other components in plain text documents. It is helpful to know some amount of markdown to get started, but as we will see, Quarto can also be used similar to word processor (using a visual editor).
Get to know Markdown:
- The basics of Markdown
- If using RStudio, open the command palette (Shift-Command-PShift-Command-P); type and select the “Markdown Quick Reference”.
What do you need to get started?
To know the format in which you want to report your code, images, links, commentary, and results.
Install the Quarto CLI.
Choose the tool / platform you want to use to get started adding code and commentary

VS Code, Juptyer Lab, RStudio, Neovim, other editors; image from quarto.org
The Quarto CLI is built into your latest RStudio installation. Other editors (e.g., Emacs, Vim/neovim, sublime text) will require installation of Quarto CLI; there may also be an associated extension for features like syntax highlighting.
The Quarto documentation is excellent, and will help you get started quickly with a tool selection guide.
Let’s get started with RStudio.
This tutorial was created using VS Code.
Open a new .qmd file
To create a Quarto document:
File > New File > Quarto Document
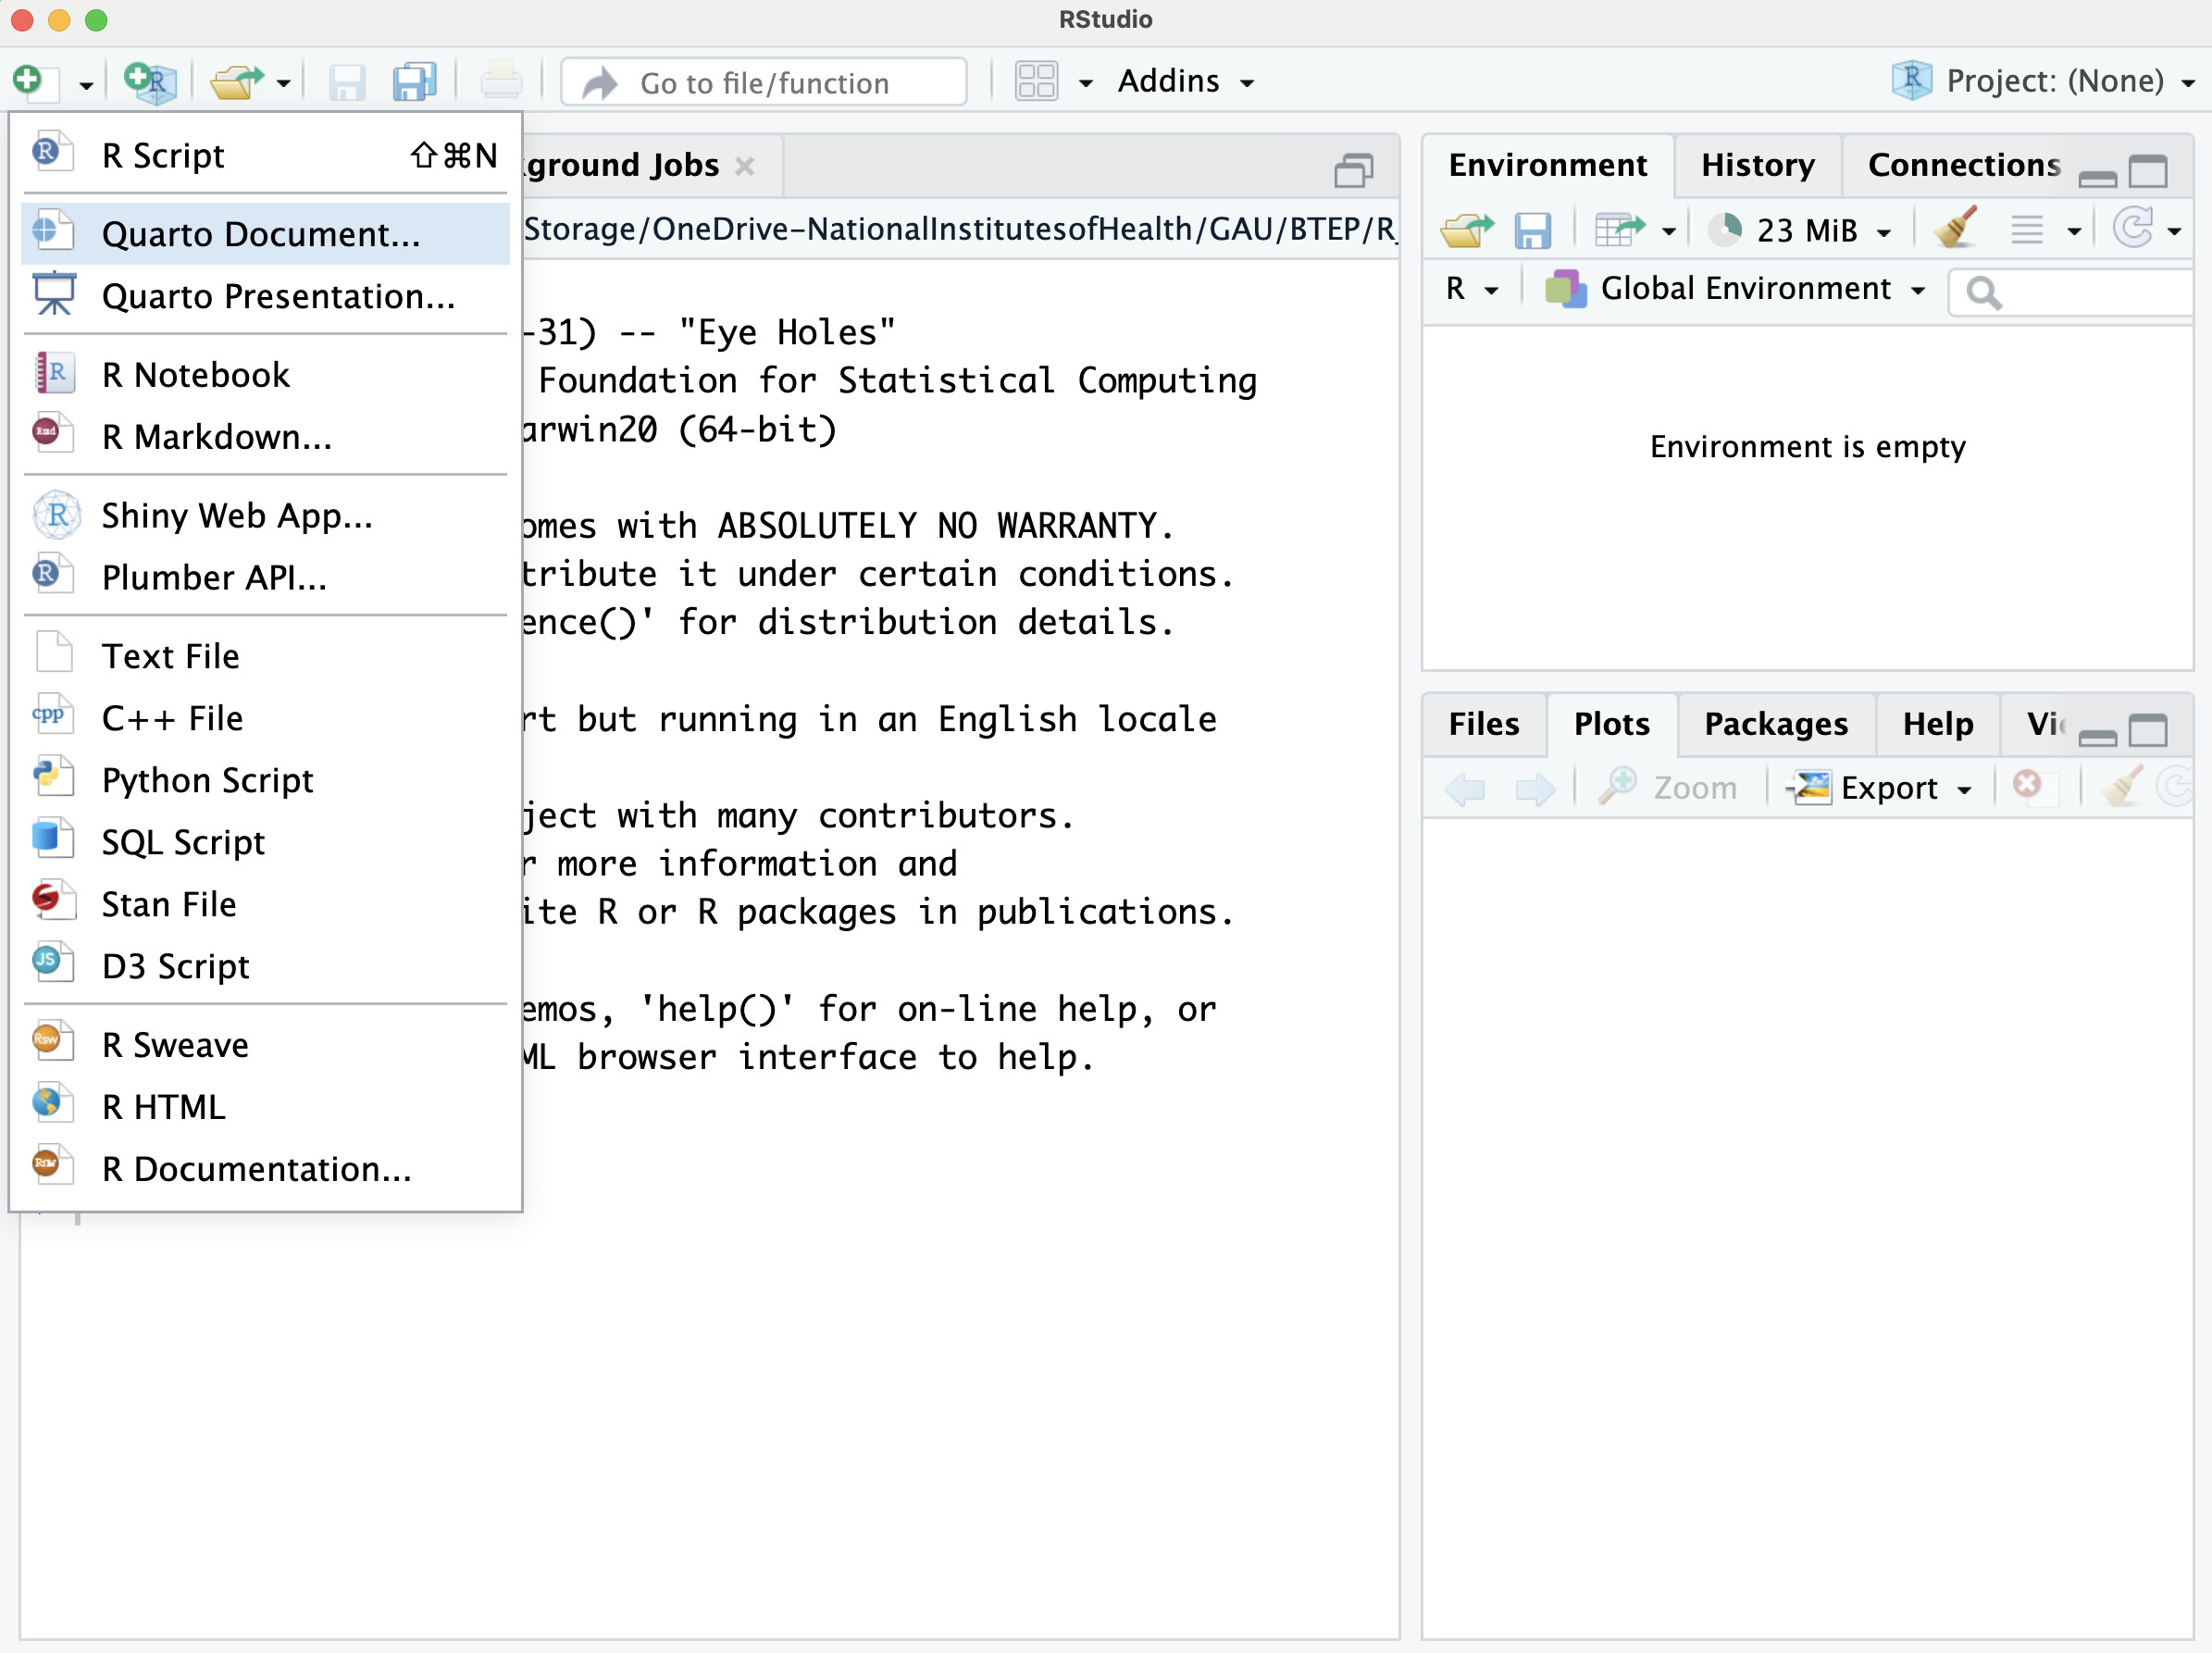
This will open a window to easily modify initial options. Here, we can select Quarto outputs such as a document, presentation, or interactive, and the output format (e.g., for a document, html, pdf, word). We can adjust the engine (knitr or jupyter), and our choice of editor (source vs visual editor).
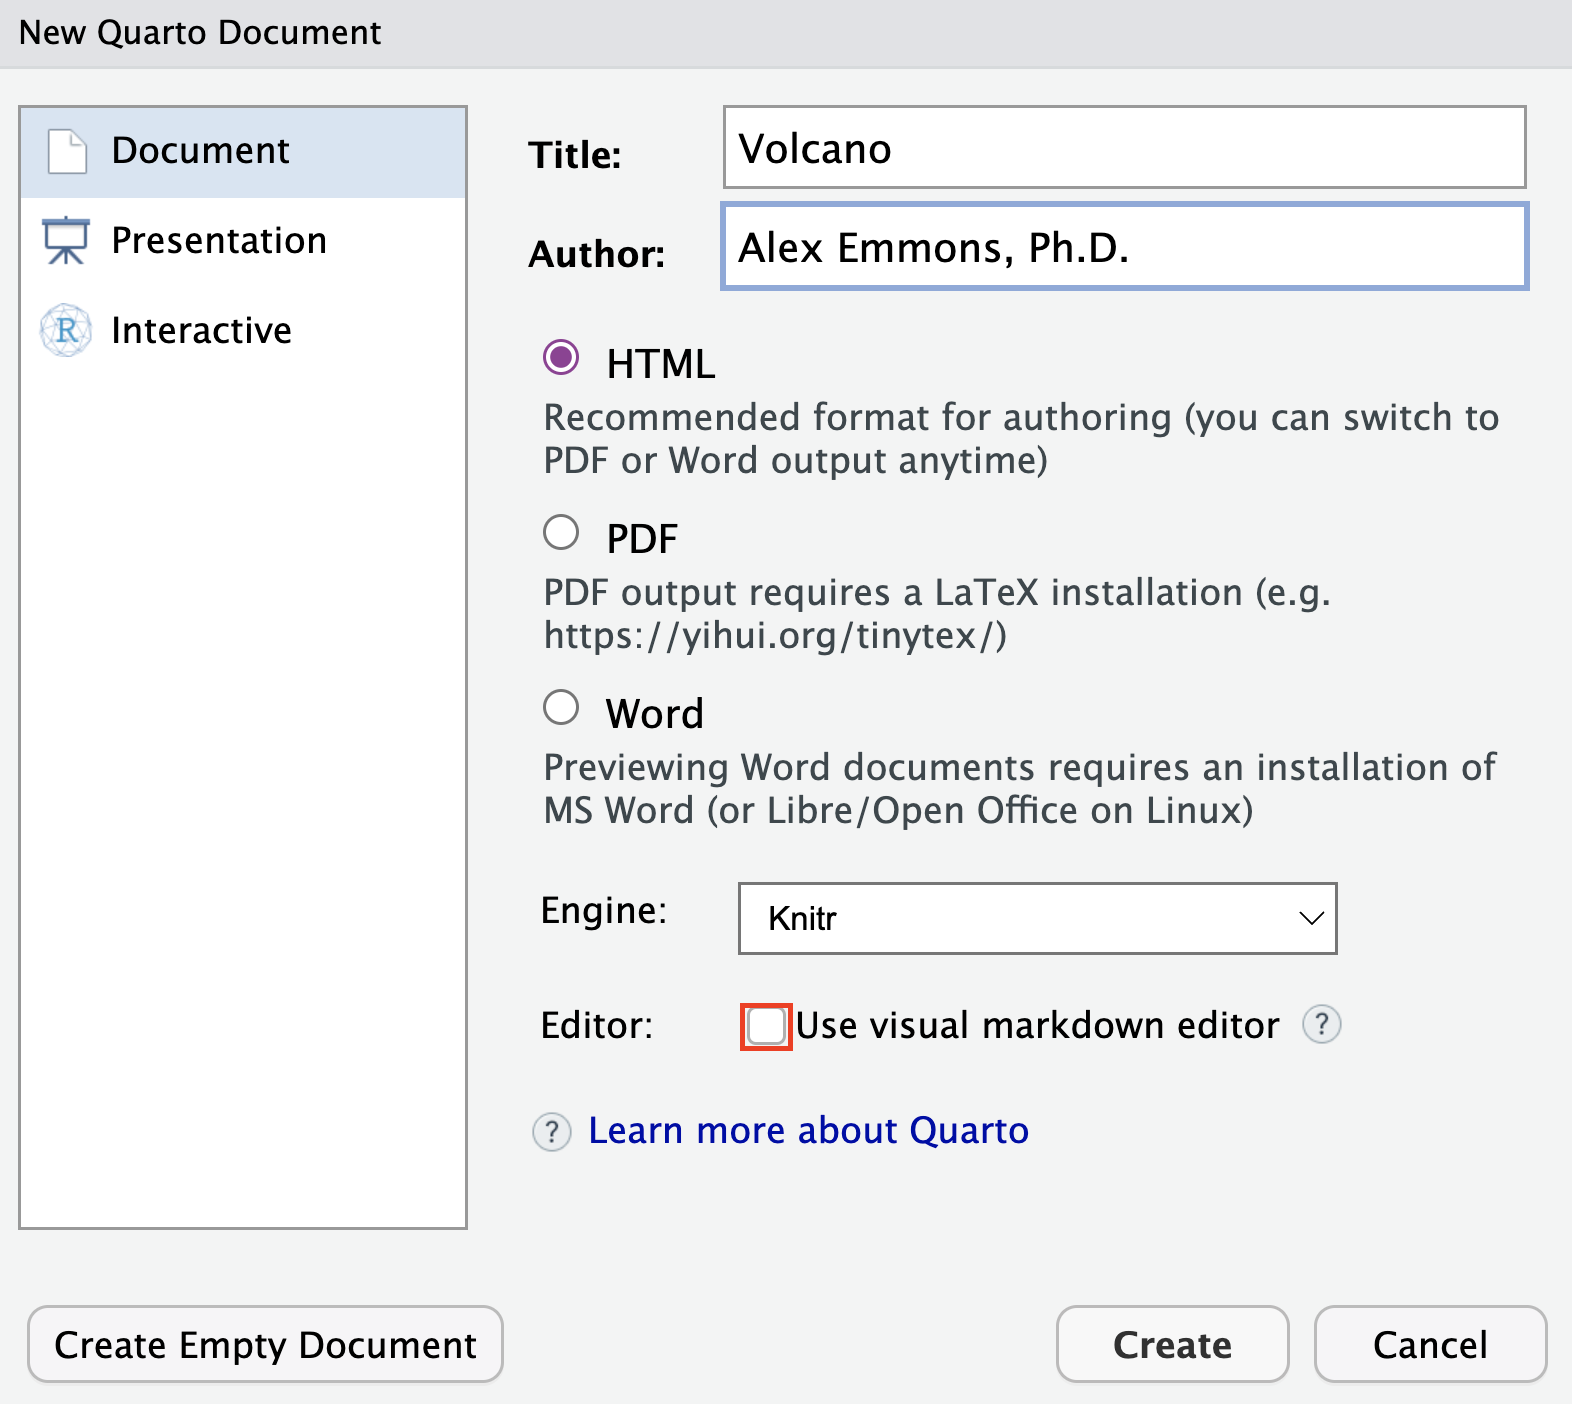
Don’t know markdown? No problem. Use the Visual editor.
I am familiar with markdown and use it regularly, so I deselected “Use visual markdown editor”. However, one of the great things about Quarto is that you do not really need to know markdown to use it. You can use a “What you see is what you mean (WYSIWYM)” editing interface. This provides an editor toolbar along with other shortcuts to enhance the editing process.
The visual editor can be used along with markdown syntax. They do not need to be mutually exclusive.
You can switch between the visual editor and the source editor at the top of the document.
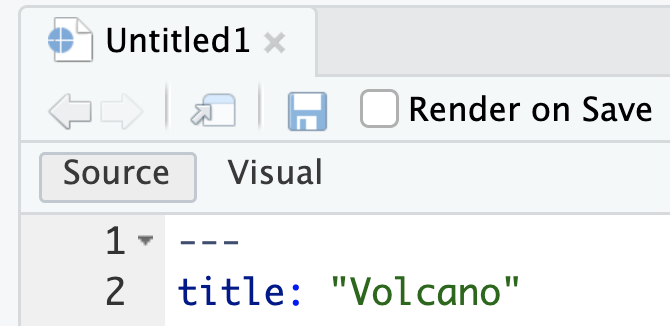
A new Quarto document in RStudio, will include example text to help get you started.
Anatomy of Quarto document
Now that we have initiated our document. Let’s get started.
There are three basic components to our document:
- yaml header (bracketed by
---)
- markdown text (images, tables, text, etc.)
- code chunks (bracketed by
```)
yaml header
The yaml header or file allows us to control document level or project level options. Here, we can specify formats, themes, executable options, and others.
---
title: "Volcano"
author: "Alex Emmons, Ph.D."
format:
  html:
    embed-resources: true
    code-fold: true
    code-tools: true
    code-overflow: wrap
toc: true
date: "January 17, 2024"
date-modified: last-modified
params:
  data: "./deseq2_DEGs.csv"
---
Here, we have included the title of the document, the author, today’s date, the date last modified, and the format (html). We have also included a table of content (toc).
code-overflow controls how code appears on the page, whether we want to scroll to view or wrap. code-fold paired with code-tools: true allows us to toggle between showing all of the code or hiding it. This also provides us with source code access.
embed-resources allows us to “produce a standalone HTML file with no external dependencies”. This will not require dependencies or internet access to view.
params allows us to include parameters with knitr to execute code with less interaction.
There are so many options to include. The Quarto reference files are helpful for understanding what can go in the yaml (example for html output). Many of the options that can be specified in the yaml can also be applied to individual code blocks as needed.
Add commentary with markdown
Without adding text, images, links, and other components, the Quarto document wouldn’t be very useful. Prose can be added using markdown language; again, see the basics here.
# Volcano Quarto Demonstration

Here we will create a volcano plot from differential expression results.

::: {.callout-tip}
Labels are ensembl IDs. For a more useful figure, add an annotation step.
:::

Learn more about Volcano plots [here](https://training.galaxyproject.org/
training-material/topics/transcriptomics/tutorials/rna-seq-viz-with-volcanoplot/
tutorial.html){target=_blank}.

## Create a Volcano Plot from DESeq2 differential expression results
We can add headers with #, ##, ###, etc.
We can add links with [Link label](link address).
We can add notes and other admonitions with callout blocks (::: {.callout-tip} :::)
Add executable codeblocks
### Load the libraries

```{r}
#| message: false
library(EnhancedVolcano)
library(dplyr)
```

### Load the data from command line arguments

The data were filtered to remove adjusted p-values that were NA; these were genes excluded by `DESeq2` as a part of independent filtering.

```{r}
data<-read.csv(params$data,row.names=1) %>% filter(!is.na(padj))
```


### Plot

Create label subsets for plotting.

```{r}
labs<-head(row.names(data),5)

```

@fig-volcano_plot allows us to identify which genes are statistically significant with large fold changes.

```{r}
#| label: fig-volcano_plot
#| fig-cap: "Enhanced Volcano Plot of bulk RNA-seq data from the package airway"
#| warning: false
EnhancedVolcano(data,
                title = "Enhanced Volcano with Airways",
                lab = rownames(data),
                selectLab=labs,
                labSize=3,
                drawConnectors = TRUE,
                x = 'log2FoldChange',
                y = 'padj')

```

Other files in this working directory:

```{bash}
ls
```
We can add code blocks using ```{r}``` or ```{python}``` or ```{bash}```. Python requires the reticulate package when using knitr.
We can add code chunk options using #|. Many of these options can be applied to all code chunks in the yaml header. See this tutorial for a more comprehensive tutorial on managing code blocks.
The finished product of our example
Let’s check out how the above example renders. To render, we select the Render button or use keyboard shortcuts (Shift-Command-KShift-Command-K). We can adjust how to view our rendered document using the gear icon.
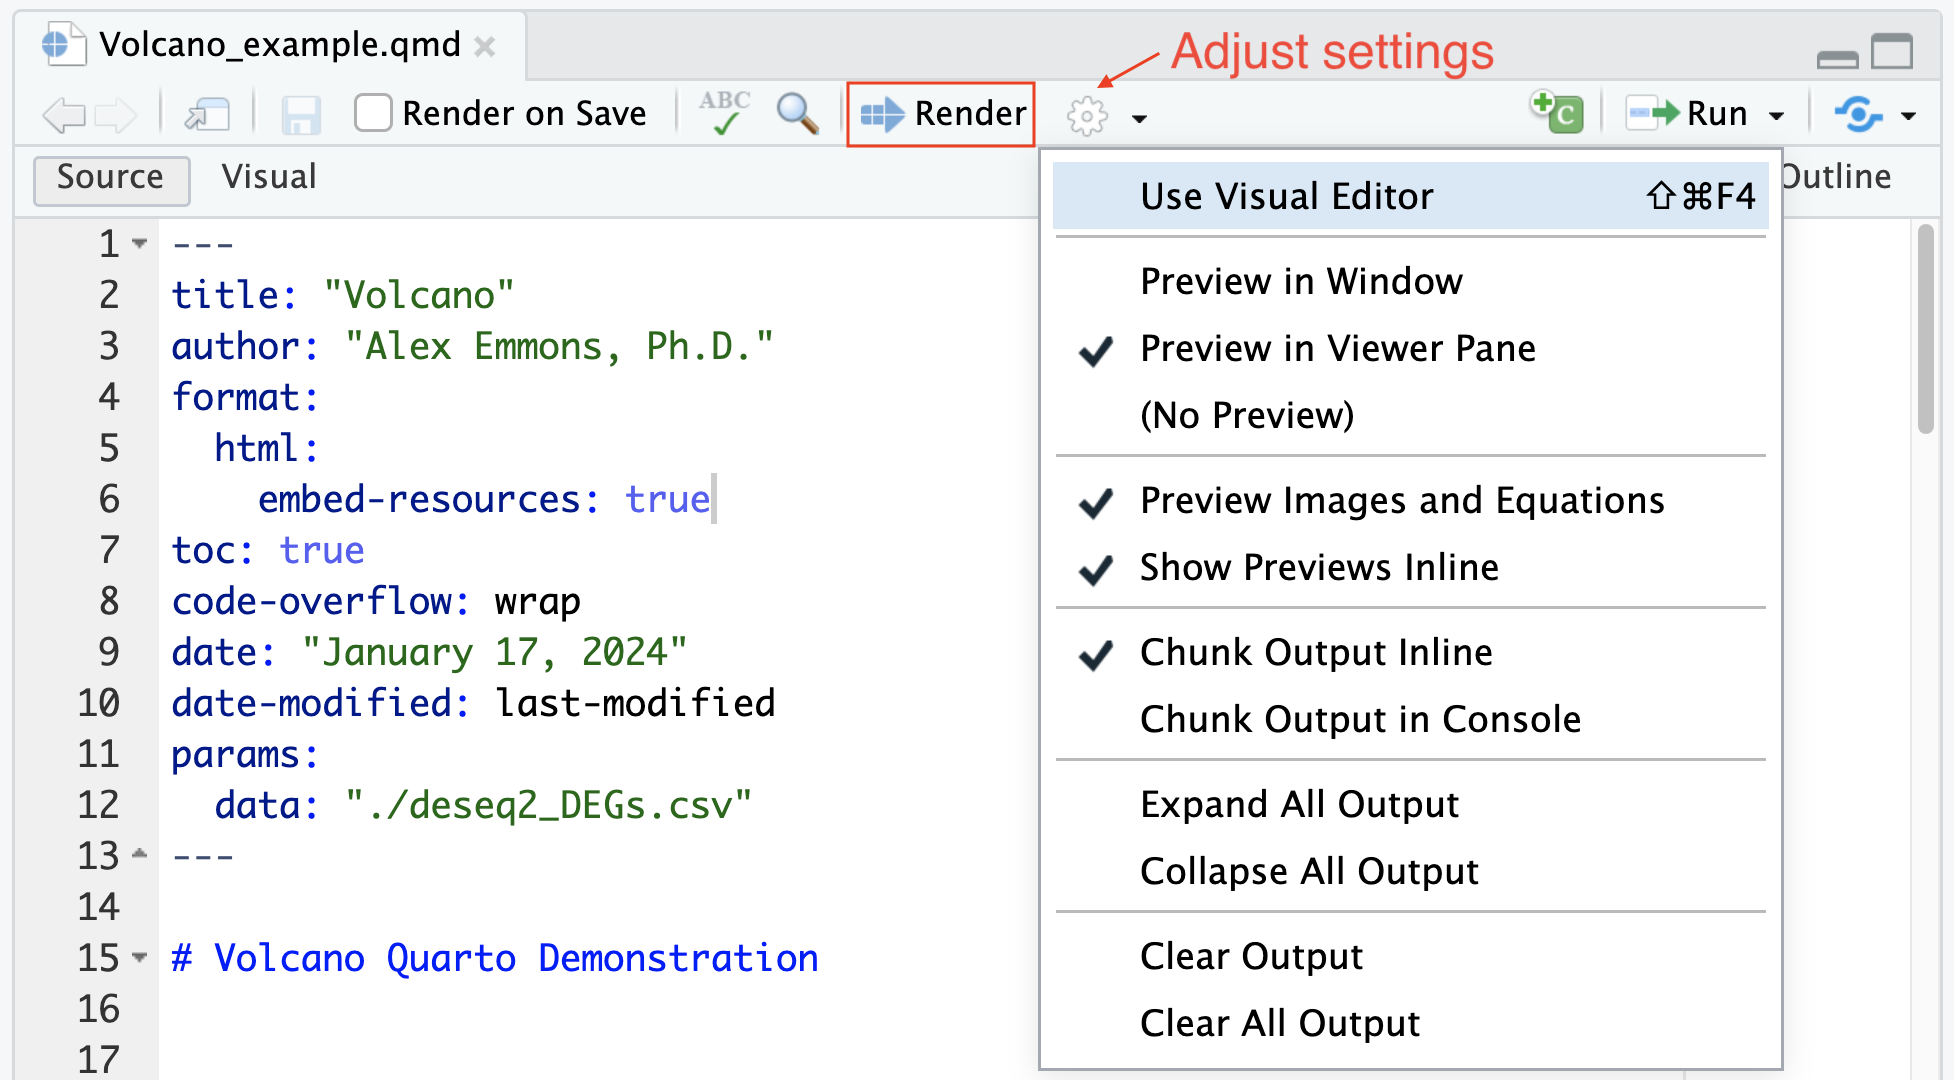
We can also render from the R console or the system shell:
R Console:
```{r}
library(quarto)
quarto_render("Volcano_example.qmd")
```
Shell:
```{bash}
quarto render Volcano_example.qmd
```The finished report
Help
- Quarto has extensive documentation. Check out the guide for help.
- Within RStudio check out the “Markdown Quick Reference” (Shift-Command-PShift-Command-P opens the command pallete to search for the reference).
- Email us at ncibtep@nih.gov for bioinformatics related questions.
Acknowledgements
The following resources were used in the creation of this tutorial:
