Lesson 4: Feature table filtering, taxonomic classification, and phylogeny
Learning objectives
- learn how to apply different types of filtering to your ASV table and representative sequence data.
- classify your ASVs.
- Generate a phylogenetic tree.
Now that we have imported and denoised, let's move on to feature table filtering, taxonomic classification, and phylogenetic tree construction. For this lesson, we will use a much larger feature table that contains the entire data set from Taur et al. 2018 (See the QIIME2 Cancer Microbiome Tutorial). This will make the analysis more interesting.
We are going to skip a few filtering steps compared with the QIIME2 tutorial. There are great filtering functions in QIIME2. We will apply some of these, but you should have a look at the filtering tutorial. We will work directly with the autoFMT study and will skip the filtering step that returns only this group (--p-where 'autoFmtGroup IS NOT NULL').
Filtering
Methods of filtering
- Frequency based filtering, contingency based filtering, metadata based filtering
-
qiime feature-table filter-samples- Filter samples based on total number of sequences (e.g.,
--p-min-frequency 1000) - Filter samples with a minimal number of features (e.g.,
--p-min-features 10) -
Metadata based filtering:
- Retain only samples present in the metadata (e.g.,
--m-metadata-file samples-to-keep.tsv) - Retain samples based on a metadata description (e.g.,
--p-where "[subject]='subject-1'"). Uses SQLite WHERE-clause syntax (Use IN, AND, OR, AND NOT).
- Retain only samples present in the metadata (e.g.,
- Filter samples based on total number of sequences (e.g.,
-
qiime feature-table filter-features- Remove features (ASVs) with low abundances after summing across all samples (e.g.,
--p-min-frequency 10) - Remove features found in only a small number of samples (e.g.,
--p-min-samples 2)
- Remove features (ASVs) with low abundances after summing across all samples (e.g.,
- Taxonomy based filtering (
qiime taxa filter-table,qiime taxa filter-seqs) - MORE ON THIS BELOW - Distance matrix filtering (
qiime diversity filter-distance-matrix)
The filtering you apply will depend on your data and your questions. I tend to filter out low abundant taxa and depending on my question I may also filter taxa with low prevalence.
Metadata based filtering
We are going to eliminate some samples based on the timing of collection. We are interested in only the samples collected between ten days prior to their hematopoietic cell transplantation and seventy days post transplantation.
To do this, let's use the --p-where option of qiime feature-table filter-samples
qiime feature-table filter-samples \
  --i-table /data/autofmt-table.qza \
  --m-metadata-file /data/sample-metadata.tsv \
  --p-where 'DayRelativeToNearestHCT BETWEEN -10 AND 70' \
  --o-filtered-table filtered-table-1.qza
The next two steps will primarily focus on reducing run times. You may or may not want to include them in your own analysis workflow.
Feature filtering
We can filter features observed in only a single sample.
qiime feature-table filter-features \
  --i-table filtered-table-1.qza \
  --p-min-samples 2 \
  --o-filtered-table filtered-table-2.qza
Let's use wget to get the new representative sequences.
wget \
  -O 'rep-seqs.qza' \
  'https://docs.qiime2.org/jupyterbooks/cancer-microbiome-intervention-tutorial/data/030-tutorial-downstream/010-filtering/rep-seqs.qza'
qiime feature-table filter-seqs \
  --i-data rep-seqs.qza \
  --i-table filtered-table-2.qza \
  --o-filtered-data filtered-sequences-1.qza
Let's summarize our newly filtered tables.
qiime feature-table summarize \
  --i-table filtered-table-2.qza \
  --m-sample-metadata-file /data/sample-metadata.tsv \
  --o-visualization filtered-table-summ.qzv
qiime feature-table tabulate-seqs \
  --i-data filtered-sequences-1.qza \
  --o-visualization filt-asv-sequences-summ.qzv
Taxonomy
After denoising, we have unique ASVs or sequences, which in itself can be quite revealing. However, often we want to classify our sequences to know more about the organisms represented by our ASVs, particularly regarding evolutionary relationships. In QIIME2, we can classify our representative sequences using the q2-feature-classifier plugin and generate a phylogenetic tree via de novo or reference based methods.
Alignment based taxonomy consensus classifiers:
BLAST+ - local sequence alignment followed by consensus taxonomy classification
VSEARCH - global sequence alignment followed by consensus taxonomy classification
These essentially align sequences to references and take the top matches (maxaccepts) above some threshold of similarity (perc_identity) and then assign taxonomy by how well the top matches agree (min_consensus).
maxaccepts - the maximum number of hits to keep for each query
perc_identity - the percentage of similarity below which a match is rejected
min_consensus - the minimum fraction of assignments that must match the top hits from maxaccepts to be accepted as consensus assignment
A nice description of these can be found in Bokulich, N.A., Kaehler, B.D., Rideout, J.R. et al. Optimizing taxonomic classification of marker-gene amplicon sequences with QIIME 2’s q2-feature-classifier plugin. Microbiome 6, 90 (2018). https://doi.org/10.1186/s40168-018-0470-z.
Machine learning approach
The recommended method involves applying a scikit-learn multinomial naive Bayes classifier. This uses machine learning to train a classifier on a referene database and then use the trained classifier to classify your ASVs.
These classifiers work best if they are trained on your target region of interest (Werner et al. 2012), in this case V4-V5. While there are some pre-trained classifiers in the QIIME 2 Data Resources, the classifier used here was created according to the Training feature classifiers with q2-feature-classifier tutorial using Greengenes v 13.8.
The code to train the classifier
qiime tools import \
  --type 'FeatureData[Sequence]' \
  --input-path 99_otus.fasta \
  --output-path 99_otus.qza
qiime tools import \
  --type 'FeatureData[Taxonomy]' \
  --input-format HeaderlessTSVTaxonomyFormat \
  --input-path 99_otu_taxonomy.txt \
  --output-path ref-taxonomy.qza
qiime feature-classifier extract-reads \
  --i-sequences 99_otus.qza \
  --p-f-primer AYTGGGYDTAAAGNG \
  --p-r-primer CCGTCAATTYHTTTRAGT \
  --p-min-length 100 \
  --p-max-length 400 \
  --p-n-jobs 10 \
  --o-reads ref-seqs.qza
qiime feature-classifier fit-classifier-naive-bayes \
  --i-reference-reads ref-seqs.qza \
  --i-reference-taxonomy ref-taxonomy.qza \
  --o-classifier gg-13-8-99-563-926-nb-classifier.qza
Note: Files to create a train classifier are not available in DNAnexus. This code is simply for example.
We will use our trained classifier to annotate our ASVs.
qiime feature-classifier classify-sklearn \
  --i-classifier /data/gg-13-8-99-563-926-nb-classifier.qza \
  --i-reads filtered-sequences-1.qza \
  --o-classification taxonomy.qza
And generate a summary of the results:
qiime metadata tabulate \
  --m-input-file taxonomy.qza \
  --o-visualization taxonomy.qzv
Taxonomic based filtering
By targeting 16S rRNA, we want to target bacteria and archaea. Therefore, we can exclude sequences that are unexpected such as those from chloroplasts or mitochondria. By setting --p-include p__, we are retaining only sequences annotated at a minimum to the phylum level. Note: this will look different depending on the database used. Greengenes specifically uses the following format for annotations: k__;p__;c__;o__;f__;g__;s__. Also, --p-mode contains ensures that search terms are case insensitve (e.g., mitochondria versus Mitochondria).
qiime taxa filter-table \
  --i-table filtered-table-2.qza \
  --i-taxonomy taxonomy.qza \
  --p-mode contains \
  --p-include p__ \
  --p-exclude 'p__;,Chloroplast,Mitochondria' \
  --o-filtered-table filtered-table-3.qza
Let's also remove these from our feature data to save computational time later.
qiime feature-table filter-seqs \
  --i-data filtered-sequences-1.qza \
  --i-table filtered-table-3.qza \
  --o-filtered-data filtered-sequences-2.qza
Visualizing our taxonomy
We can visualize sample by sample taxonomic composition using a stacked bar plot generated with qiime taxa barplot. Let's take a look.
qiime taxa barplot \
  --i-table filtered-table-3.qza \
  --i-taxonomy taxonomy.qza \
  --m-metadata-file /data/sample-metadata.tsv \
  --o-visualization taxa-bar-plots-1.qzv

Phylogeny
In addition to clasifying our organisms, we also want to reconstruct their phylogenetic relationships by generating a phylogenetic tree. We often assume that phylogenetic closeness can elucidate commonalities in phenotypic properties / functions, so it is worth examining. Moreover, we will need these trees later for alpha and beta diversity measures.
We can generate a phylogenetic tree using:
- de novo methods - constructed without a reference database
- reference based methods - uses a reference database
- SEPP fragment insertion will insert sequences into a reference phylogeny, with the caveat that sequences not at least 75% similar to any sequence in the tree is discarded. (This is a nice solution for meta analyses, but can be computationally intensive.)
For more details, refer to the QIIME 2 documentation.
We will perform a de novo method here, using a pipeline available in the q2-phylogeny plugin (qiime phylogeny align-to-tree-mafft-fasttree).
This will run through the following steps:
-
generates a multiple sequence alignment
-
masks the alignment (removes errors, uniformative sites, repetitive regions, which can lose some resolution)
-
builds a tree [de novo methods output an unrooted tree, which lacks directionality (no inferrred ancestry)]
-
root the tree (a rooted tree is required for alpha and beta diversity metrics) - the unrooted tree is rooted at its midpoint
Example of unrooted vs rooted (at midpoint):
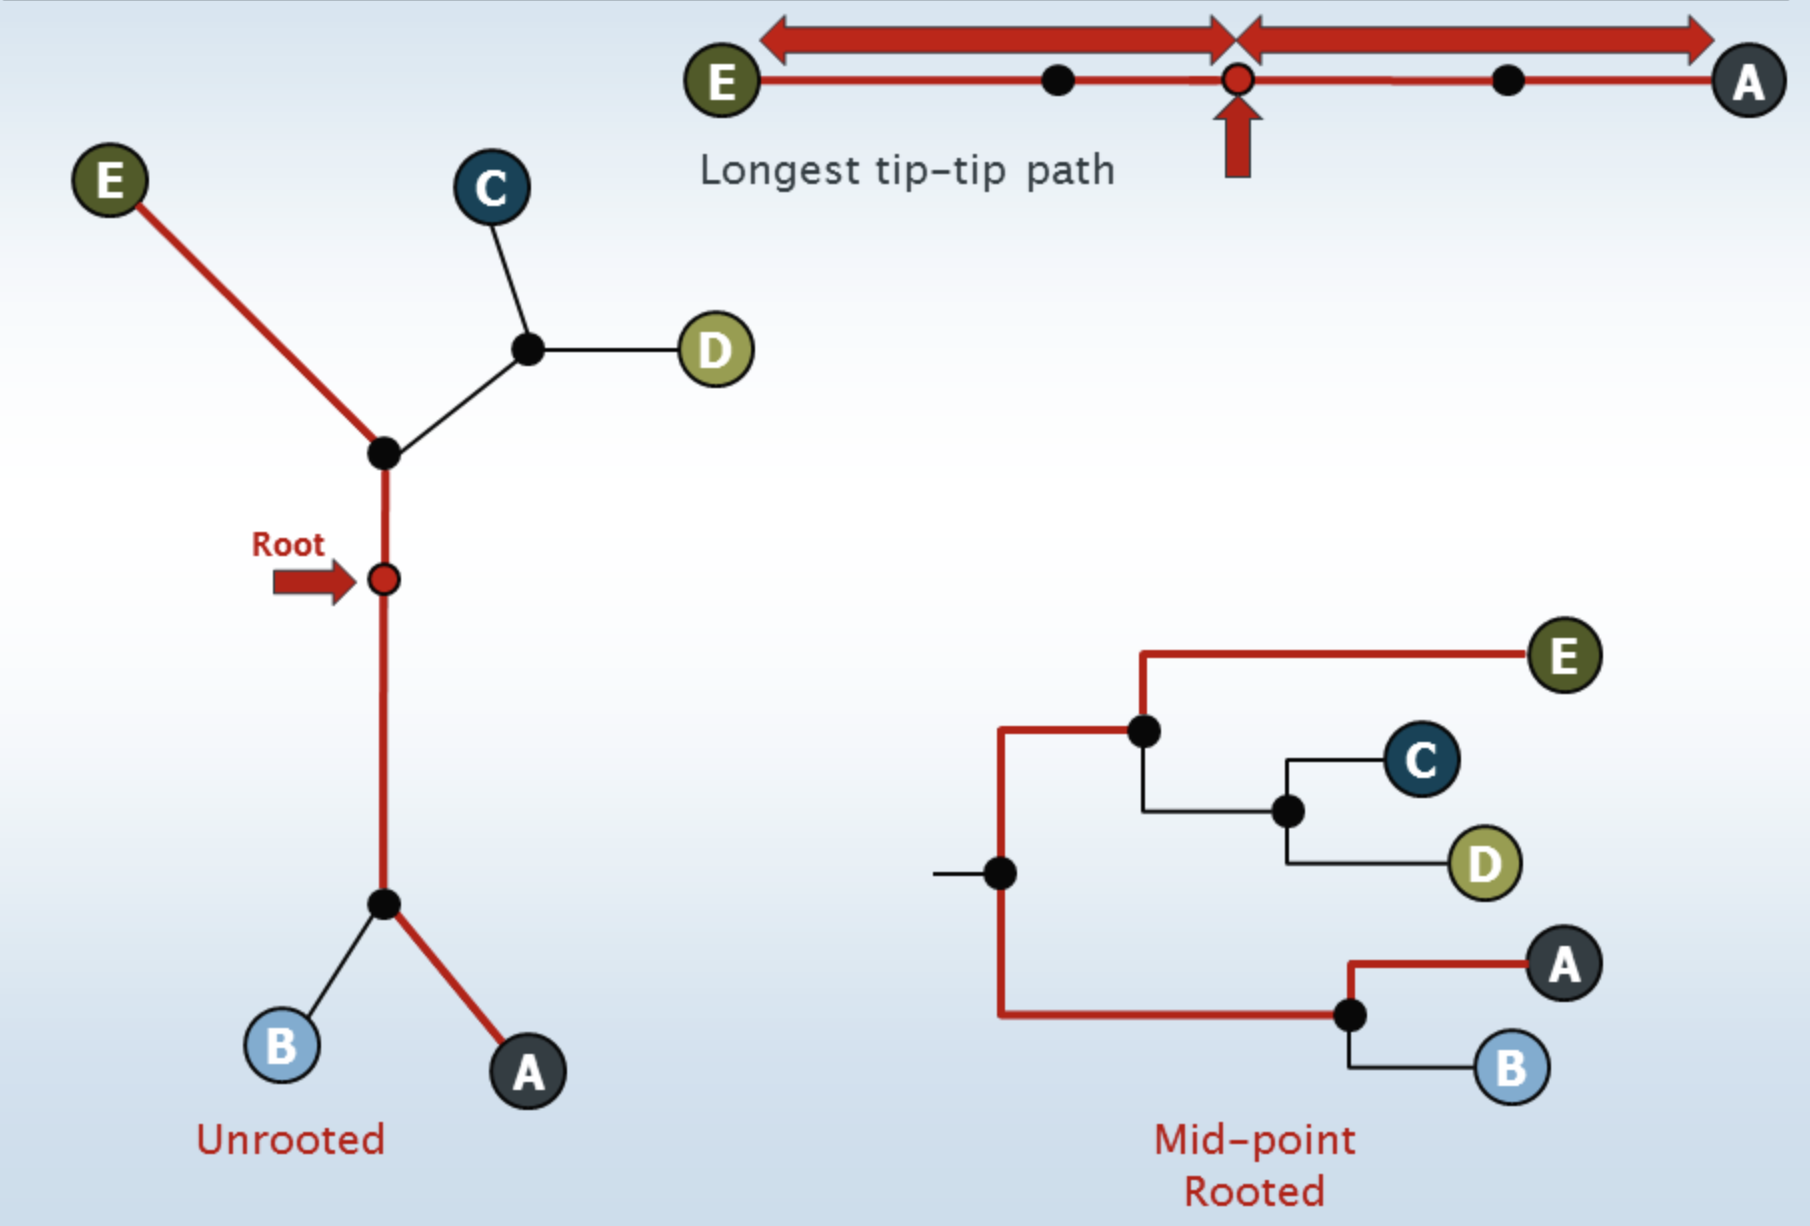
Image from The Cabbages of Doom, How to root a phylogenetic tree
Let's run the pipeline:
qiime phylogeny align-to-tree-mafft-fasttree \
  --i-sequences filtered-sequences-2.qza \
  --output-dir phylogeny-align-to-tree-mafft-fasttree
There is not visual output to view here.