Lesson 7: Course Wrap-Up
Learning Objectives
- Introduce the QIIME2 microbiome workflow for Biowulf
- Review key concepts
- Showcase additional plugins
QIIME 2 on Biowulf
As mentioned previously, QIIME 2 is installed on Biowulf.
To see available versions use
module avail qiime
The default version on Biowulf is qiime2-2021.4, and the latest installed version is qiime2-2022.2.
If you are interested in a reproducible workflow to use on Biowulf, Samantha Chill, a bioinformatician with CCBR, created a workflow that is readily available from github.
Review
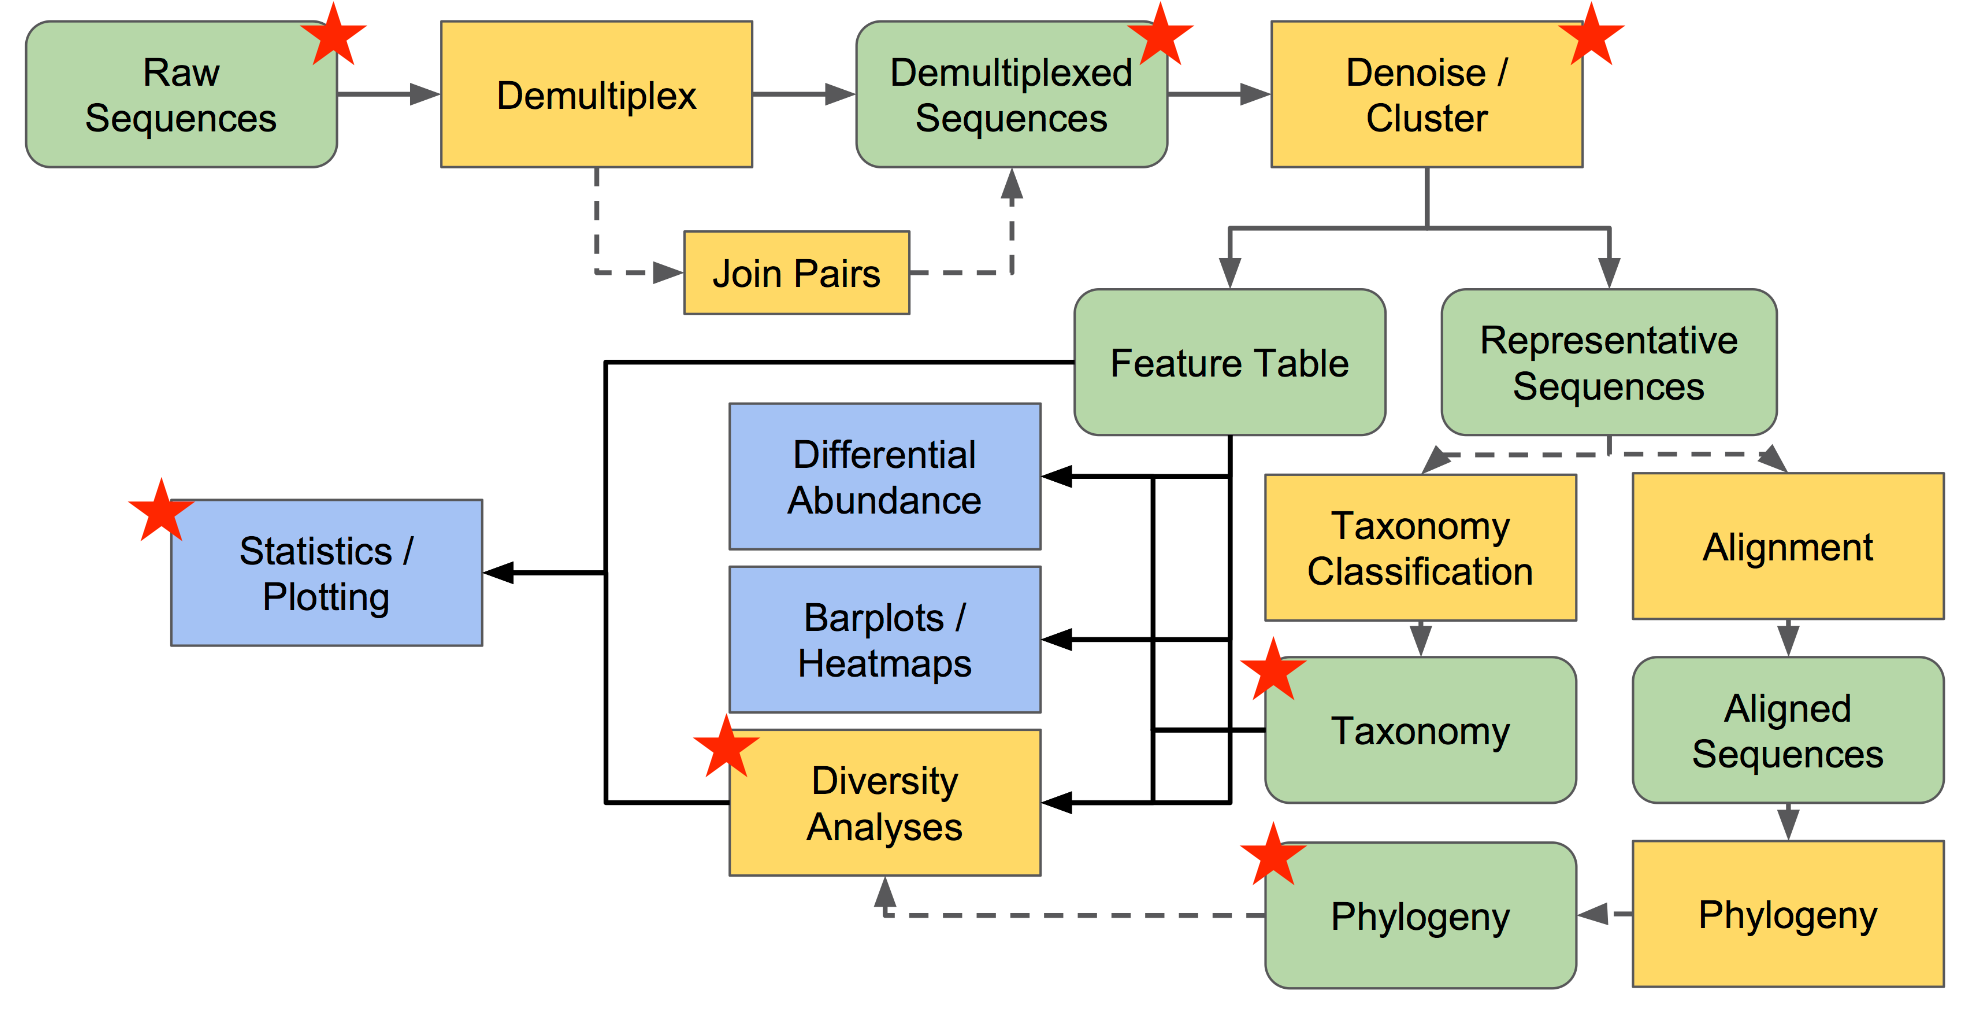
Image adapted from docs.qiime2.org (Conceptual Overview of QIIME 2) .
What have we done?
Using a small subset of data:
- Imported raw fastq files using
qiime tools import. Data was paired-end CASAVA format. - Checked for primers using
qiime cutadapt trim-paired. - Denoised with
qiime dada2 denoise-pairedand generated summaries of our feature table and representative sequences.
Using the larger data set:
- Filtered samples and features based on metadata categories and other thresholds.
- Classified our sequences using a Greengenes trained (V4-V5) classifier and
qiime feature-classifier classify-sklearn - Applied taxonomic filtering
- Generated a de novo phylogenetic tree using
qiime phylogeny align-to-tree-mafft-fasttree - Chose a rarefaction depth using the qiime 2 feature table summary and rarefaction curve
- Generated several core alpha and beta diversity metrics and visualizations
These are our core steps, but let's also take a look at some of the other analysis plugins and methods available in QIIME 2.
Other plugins of interest
Differential abundance testing
Differential abundance testing examines which taxa are significantly different in abundance between conditions. However, challenges such as sparsity, compositionality, and library size differences make this challenging to determine.
Methods in QIIME 2
ANCOM (Analysis of Composition of Microbiomes)
- additive log ratio approach
- assumes that less than 25 % of features change between groups
- q2-composition plugin
- Need to filter rare taxa
- w-statistic - the number of null hypotheses rejected
See the Moving Pictures tutorial.
- uses balance trees (isometric log-ratio transformation)
- Need to filter rare taxa
- Check out this explanation
- center log ratio approach
- used for multiple types of NGS data (e.g., RNA-Seq)
- tested for QIIME 2 version 2019.7
Note: Different methods produce different results, and methods are sensitive to upstream processing decisions. ALDEx2 and ANCOM-II were found to be more conservative but less sensitive than other methods, which means they are less prone to false positives.
ANCOM example
Let's use our practice data set to run ANCOM.
Step 1: Filter out low abundance / low prevalent ASVs. Note: this will shift the composition of the samples, and thus could bias results.
mkdir ancom

qiime feature-table filter-features \
  --i-table /data/practice/04_filter/filtered-table3.qza \
  --p-min-frequency 50 \
  --p-min-samples 2 \
  --o-filtered-table ancom/ancomfilt.qza
Step 2: Add pseudo-counts - This method does not tolerate zeros.
qiime composition add-pseudocount \
  --i-table ancom/ancomfilt.qza \
  --o-composition-table ancom/comp-table.qza
The only metadata category of interest in the data set is DataType, old vs young. Now, let's run ancom.
qiime composition ancom \
  --i-table ancom/comp-table.qza \
  --m-metadata-file /data/practice/metadata.txt \
  --m-metadata-column DataType \
  --o-visualization ancom/ancom-OY.qzv
Core microbiome
If interested in highly prevalent taxa, you could use qiime feature-table core-features, which identifies "features observed in a user-defined fraction of the samples." By default, this will return features observed in at least 50% of samples.
Random forest regression and classification
Can we use microbial community composition to predict a condition? For example, maybe we are interested in whether microbial community composition can predict a cancer state from a non-cancer state.
In QIIME 2, we could use the q2-sample-classifier, which uses supervised learning (default = Random Forest classification).
Supervised learning classifiers predict the categorical metadata classes of unlabeled samples by learning the composition of labeled training samples. --- https://docs.qiime2.org/2022.8/tutorials/sample-classifier/.
Random Forest example
Let's use our practice data set again, and see if we can predict group membership (old vs young) by microbial composition. We will use the sample-classifier pipeline. This pipeline splits our data into training and testing sets, trains the model using the --p-estimator of choice, performs k-fold cross-validation (5 by default), tests the model on the test set, and calculates model accuracy by comparing true values versus predicted values of the test set.
qiime sample-classifier classify-samples \
  --i-table /data/practice/04_filter/filtered-table3.qza \
  --m-metadata-file /data/practice/metadata.txt \
  --m-metadata-column DataType \
  --p-optimize-feature-selection \
  --p-parameter-tuning \
  --p-estimator RandomForestClassifier \
  --p-random-state 123 \
  --output-dir rforest
We can move our visualizations to ~/public to view some of these outputs.
Other notable plugins
- compositional beta diversity with biplots
- performs a Robust Aitchison PCA
- can improve taxonomic classifications
- uses taxonomic weights based on environment
- functional prediction from 16S rRNA data
- a new implementation of the Short MUltiple Regions Framework (SMURF)
- provenance replay
- generate reproducible code based on your QIIME 2 inputs and outputs
Exporting results
Many of the QIIME 2 visualizations allow you to directly download results in a tab-delimited format. You can also unzip any QIIME 2 visualization (.qzv) or QIIME 2 artifact (.qza) and access data in the data directory.
There is also an export method in QIIME 2 (qiime tools export). Let's export a feature table.
First, let's simply unzip a feature table artifact.
unzip -d filtered-table3 filtered-table-3.qza
Now, let's use qiime tools export.
qiime tools export \
  --input-path filtered-table-3.qza \
  --output-path exported-feature-table-3
Working in R
There are many packages available to work with microbiome data in R. While there is an R API in the works for QIIME 2, for now, users can use the R package, qiime2R, to easily import QIIME 2 files.
Phyloseq is a fantastic Bioconductor package for microbiome analysis with R, and qiime2R can import QIIME 2 files as phyloseq objects.
Struggling with command line?
- Try QIIME 2 Galaxy implementation
- Nephele
- MicrobiomeAnalyst
If you have any questions about your microbiome analysis, do not hesitate to email us at ncibtep@nih.gov.