Lesson 5: Quality Control and Cleaning of Next Generation Sequences
Lesson 5 Review
Lesson 5 introduced the basics bulk of RNA sequencing, including experimental considerations and basic ideas behind data analysis. In this class, participants will initiate a bulk RNA sequencing analysis using a pipeline and be introduced to quality control metrics for FASTQ files derived from Next Generation Sequencing and data cleanup steps required for downstream analysis.
Learning Objectives
After this class, participants will be able to:
- Apply Unix skills to run a bulk RNA sequencing analysis pipeline.
- Interpret quality assessment metrics for next generation sequences.
- List tools and describe data cleanup procedures for next generation sequencing data.
Sign onto Biowulf
Before getting started, sign onto Biowulf's HPC OnDemand either through student account at https://hpcclass.cit.nih.gov/ or using personal account at https://hpcondemand.nih.gov/.
Navigate the RENEE Output Directory
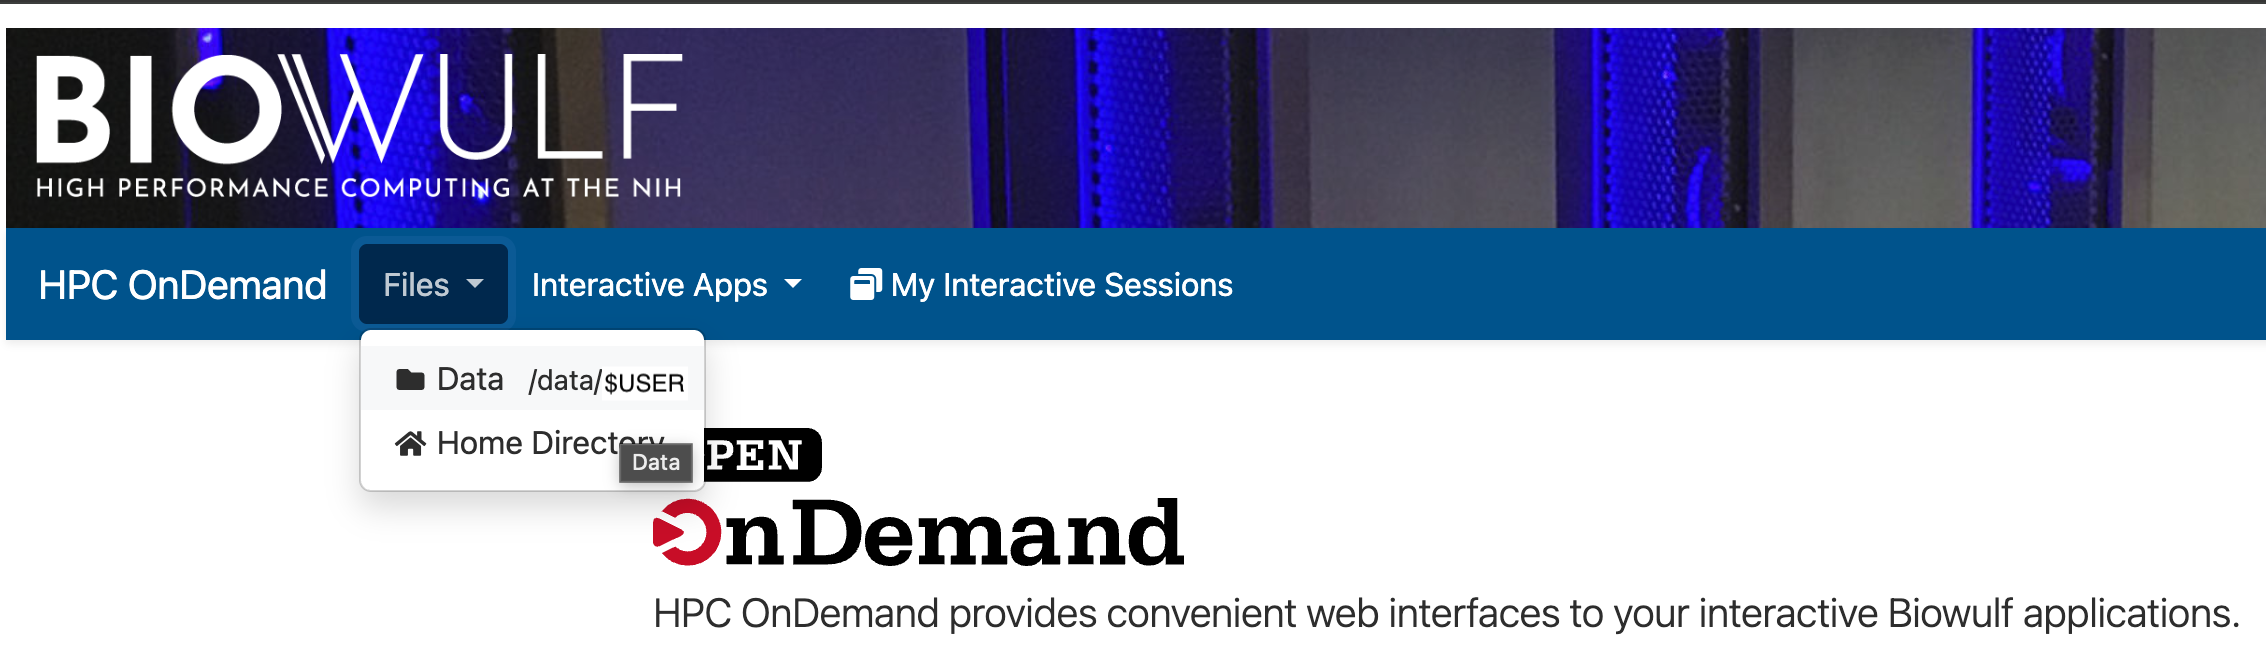
After signing on, navigate to the participant's /data/$USER folder by clicking on "Files". Recall that $USER is a variable that points to participant's Biowulf user ID.
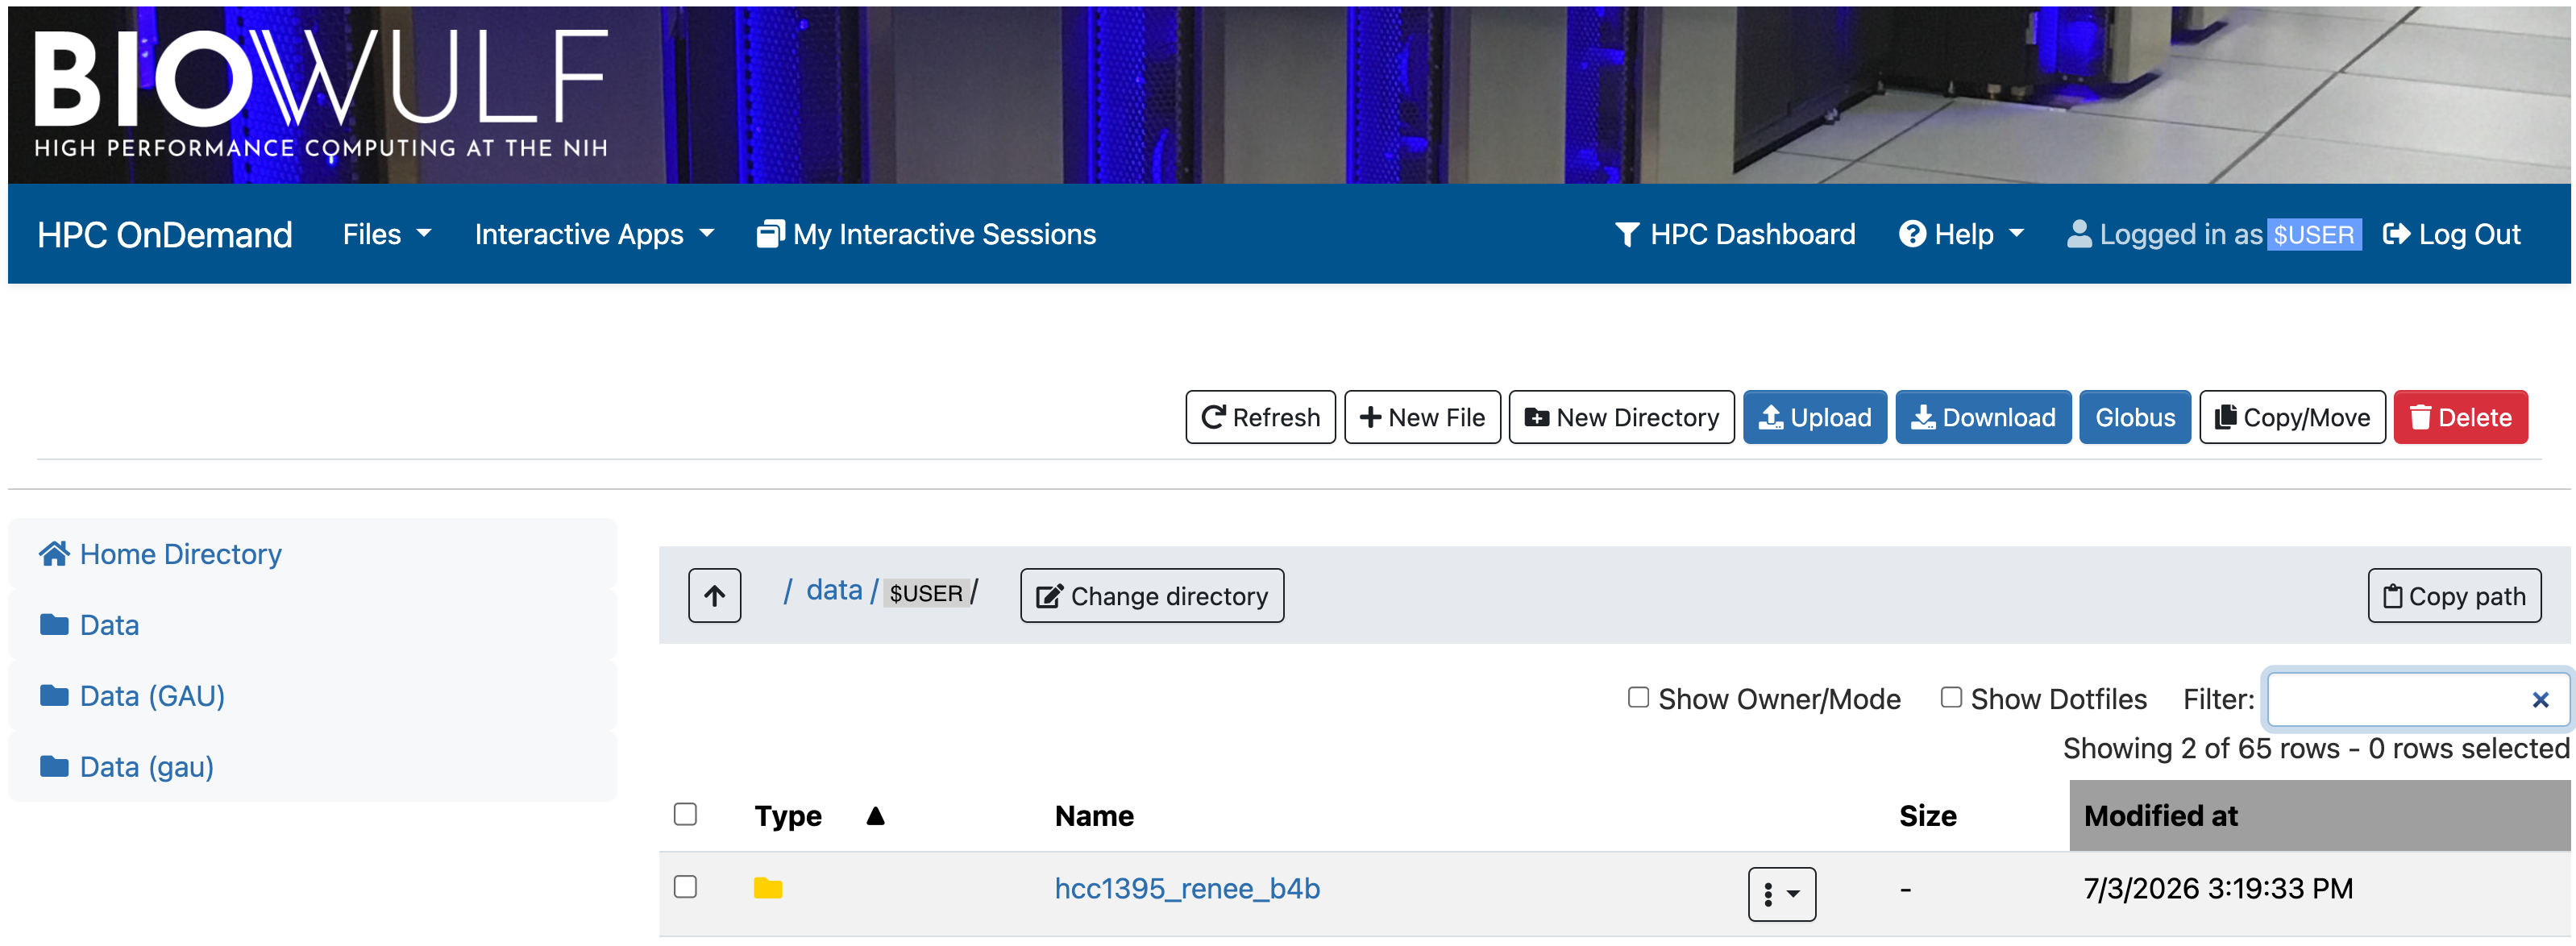
Next, navigate to the hcc1395_renee_b4b folder.
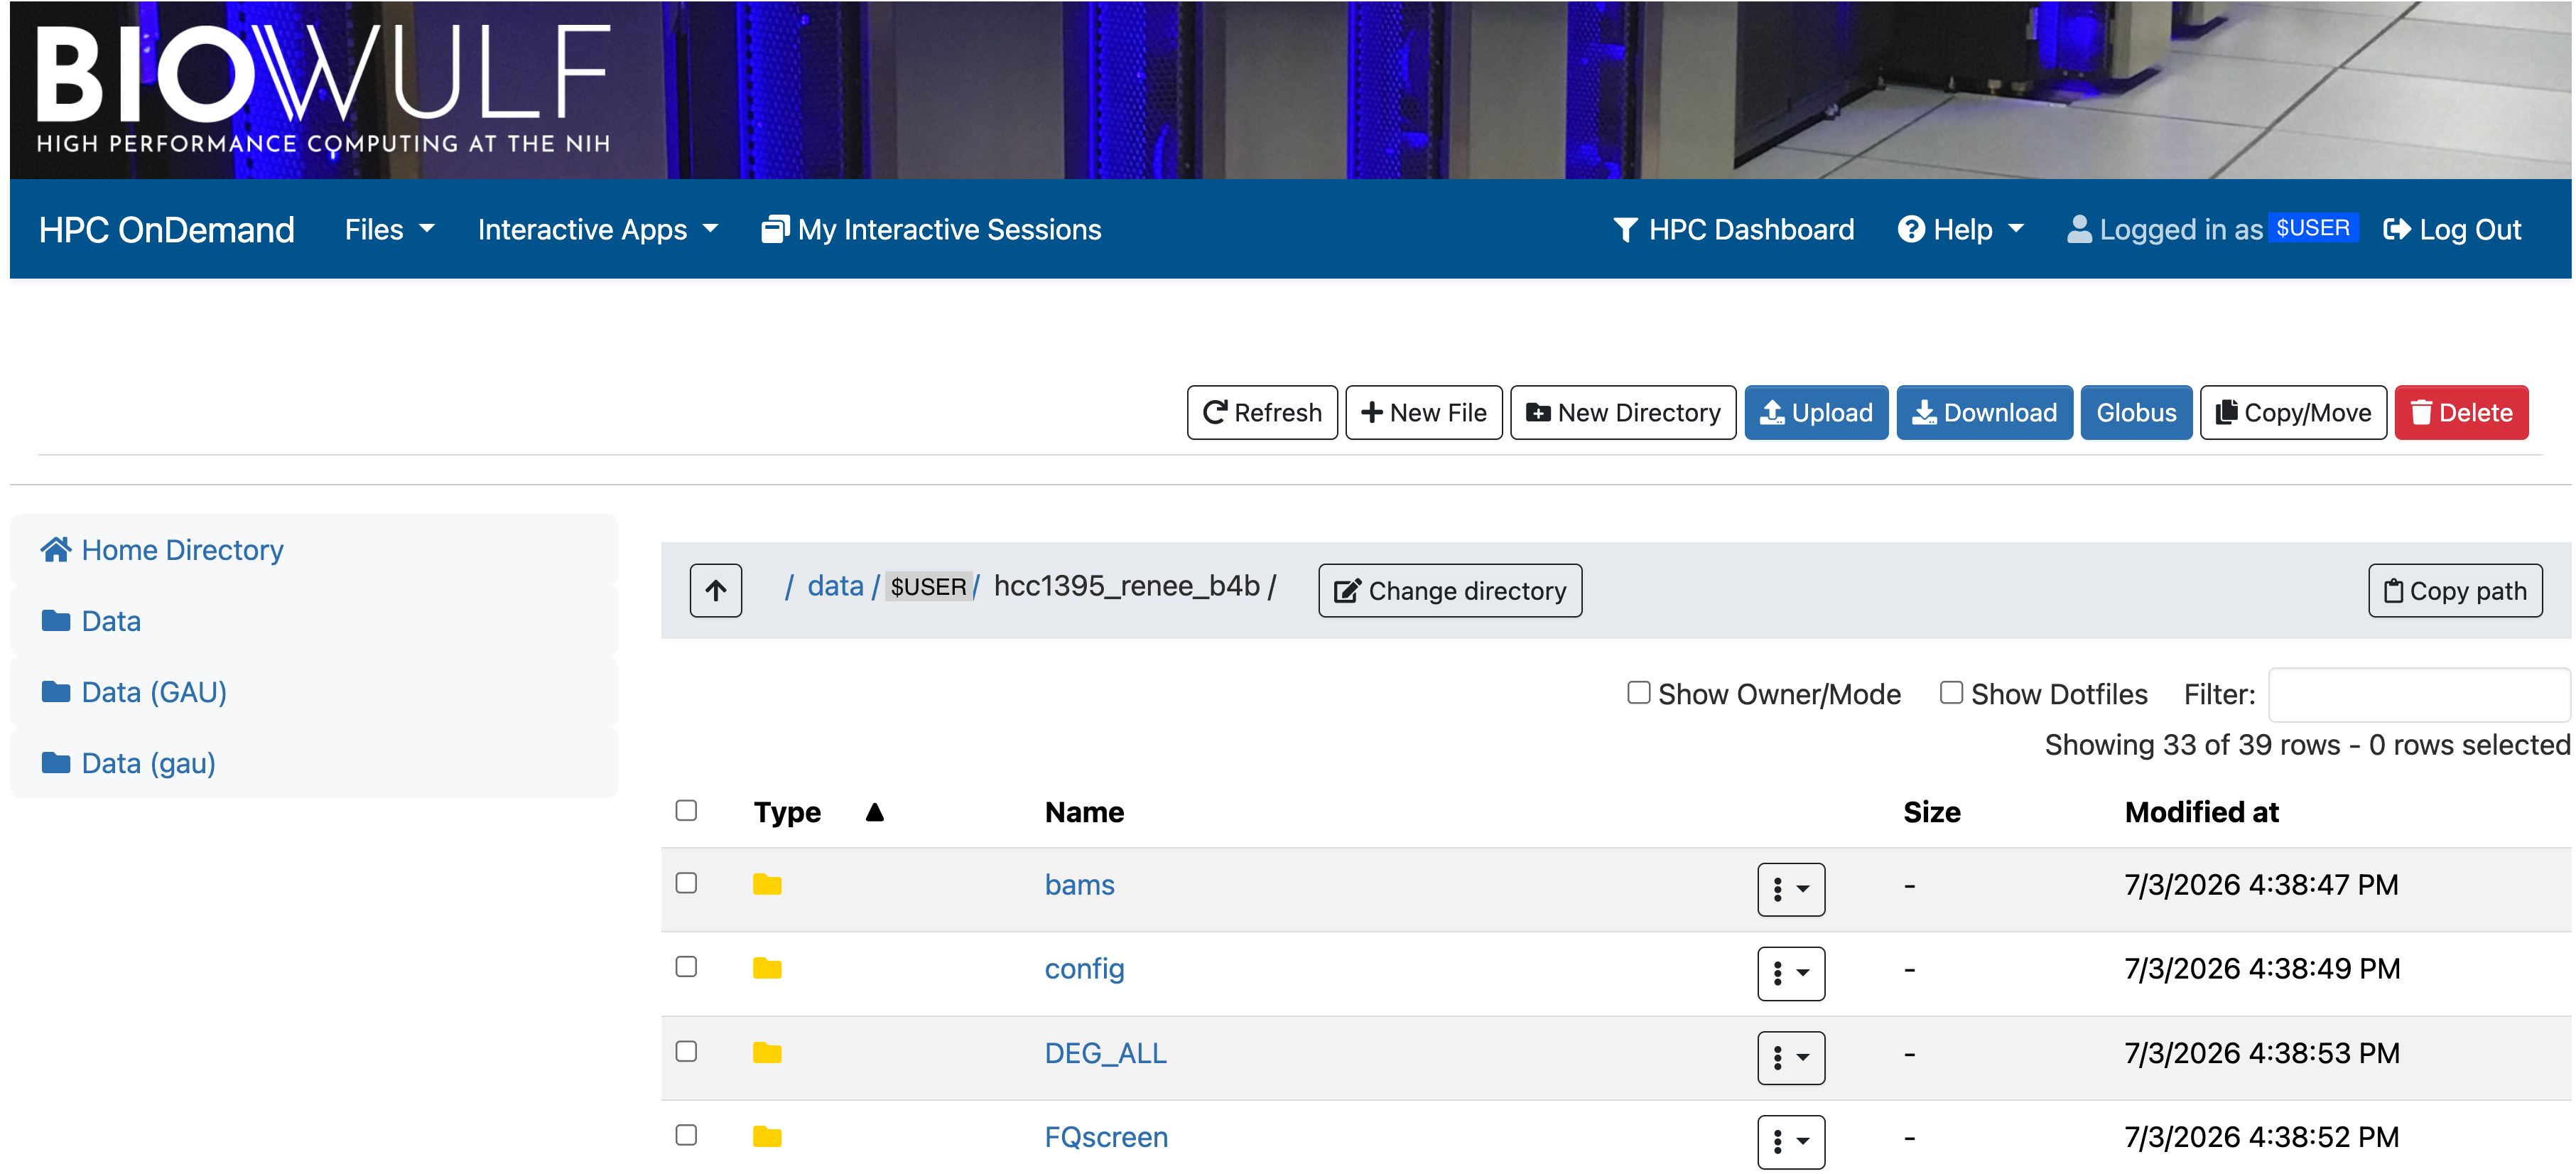
This folder contains alignment results stored in the subfolder BAM, gene expression tables stored inDEG_ALL`, and other output such as QC metrics.
List the contents of the hcc1395_renee_b4b folder in the terminal.
ls -al
total 11
drwxr-x--- 2 $USER $USER 4096 Jul  3 16:39 .
drwxrwx--- 2 $USER $USER 4096 Jul  3 16:38 ..
drwxr-x--- 2 $USER $USER 4096 Jul  3 16:38 bams
drwxr-x--- 2 $USER $USER 4096 Jul  3 16:38 .cache
drwxr-x--- 2 $USER $USER 4096 Jul  3 16:38 .config
drwxr-x--- 2 $USER $USER 4096 Jul  3 16:38 config
-rw-r----- 1 $USER $USER 8963 Jul  3 16:38 config.json
drwxr-x--- 2 $USER $USER 4096 Jul  3 16:38 DEG_ALL
drwxr-x--- 2 $USER $USER 4096 Jul  3 16:38 FQscreen
drwxr-x--- 2 $USER $USER 4096 Jul  3 16:38 FQscreen2
drwxr-x--- 2 $USER $USER 4096 Jul  3 16:38 fusions
lrwxrwxrwx 1 $USER $USER   66 Jul  3 16:38 hcc1395_normal_rep1.R1.fastq.gz -> /vf/users/$USER/hcc1395_renee/reads/hcc1395_normal_rep1.R1.fastq.gz
lrwxrwxrwx 1 $USER $USER   66 Jul  3 16:38 hcc1395_normal_rep1.R2.fastq.gz -> /vf/users/$USER/hcc1395_renee/reads/hcc1395_normal_rep1.R2.fastq.gz
lrwxrwxrwx 1 $USER $USER   66 Jul  3 16:38 hcc1395_normal_rep2.R1.fastq.gz -> /vf/users/$USER/hcc1395_renee/reads/hcc1395_normal_rep2.R1.fastq.gz
lrwxrwxrwx 1 $USER $USER   66 Jul  3 16:38 hcc1395_normal_rep2.R2.fastq.gz -> /vf/users/$USER/hcc1395_renee/reads/hcc1395_normal_rep2.R2.fastq.gz
lrwxrwxrwx 1 $USER $USER   66 Jul  3 16:38 hcc1395_normal_rep3.R1.fastq.gz -> /vf/users/$USER/hcc1395_renee/reads/hcc1395_normal_rep3.R1.fastq.gz
lrwxrwxrwx 1 $USER $USER   66 Jul  3 16:38 hcc1395_normal_rep3.R2.fastq.gz -> /vf/users/$USER/hcc1395_renee/reads/hcc1395_normal_rep3.R2.fastq.gz
lrwxrwxrwx 1 $USER $USER   65 Jul  3 16:38 hcc1395_tumor_rep1.R1.fastq.gz -> /vf/users/$USER/hcc1395_renee/reads/hcc1395_tumor_rep1.R1.fastq.gz
lrwxrwxrwx 1 $USER $USER   65 Jul  3 16:38 hcc1395_tumor_rep1.R2.fastq.gz -> /vf/users/$USER/hcc1395_renee/reads/hcc1395_tumor_rep1.R2.fastq.gz
lrwxrwxrwx 1 $USER $USER   65 Jul  3 16:38 hcc1395_tumor_rep2.R1.fastq.gz -> /vf/users/$USER/hcc1395_renee/reads/hcc1395_tumor_rep2.R1.fastq.gz
lrwxrwxrwx 1 $USER $USER   65 Jul  3 16:38 hcc1395_tumor_rep2.R2.fastq.gz -> /vf/users/$USER/hcc1395_renee/reads/hcc1395_tumor_rep2.R2.fastq.gz
lrwxrwxrwx 1 $USER $USER   65 Jul  3 16:38 hcc1395_tumor_rep3.R1.fastq.gz -> /vf/users/$USER/hcc1395_renee/reads/hcc1395_tumor_rep3.R1.fastq.gz
lrwxrwxrwx 1 $USER $USER   65 Jul  3 16:38 hcc1395_tumor_rep3.R2.fastq.gz -> /vf/users/$USER/hcc1395_renee/reads/hcc1395_tumor_rep3.R2.fastq.gz
drwxr-x--- 2 $USER $USER 4096 Jul  3 16:38 .java
drwxr-x--- 2 $USER $USER 4096 Jul  3 16:38 kraken
drwxr-x--- 2 $USER $USER 4096 Jul  3 16:38 logfiles
drwxr-x--- 2 $USER $USER 4096 Jul  3 16:38 .parallel
drwxr-x--- 2 $USER $USER 4096 Jul  3 16:38 preseq
drwxr-x--- 2 $USER $USER 4096 Jul  3 16:38 QC
drwxr-x--- 2 $USER $USER 4096 Jul  3 16:38 QualiMap
drwxr-x--- 2 $USER $USER 4096 Jul  3 16:38 rawQC
drwxr-x--- 2 $USER $USER 4096 Jul  3 16:38 Reports
drwxr-x--- 2 $USER $USER 4096 Jul  3 16:38 resources
drwxr-x--- 2 $USER $USER 4096 Jul  3 16:38 RSeQC
-rw-r----- 1 $USER $USER  139 Jul  3 16:38 run_log.R
drwxr-x--- 2 $USER $USER 4096 Jul  3 16:38 .singularity
drwxr-x--- 2 $USER $USER 4096 Jul  3 16:38 .snakemake
drwxr-x--- 2 $USER $USER 4096 Jul  3 16:39 STAR_files
drwxr-x--- 2 $USER $USER 4096 Jul  3 16:38 trim
-rw-r----- 1 $USER $USER  583 Jul  3 16:39 websockify.log
drwxr-x--- 2 $USER $USER 4096 Jul  3 16:38 workflow
FASTQC
FastQC is a tool used to assess quality of next generation sequencing data derived from Illumina instruments.
The FastQC reports for each FASTQ file are stored in the rawQC folder. Users will typically inspect the html report files.
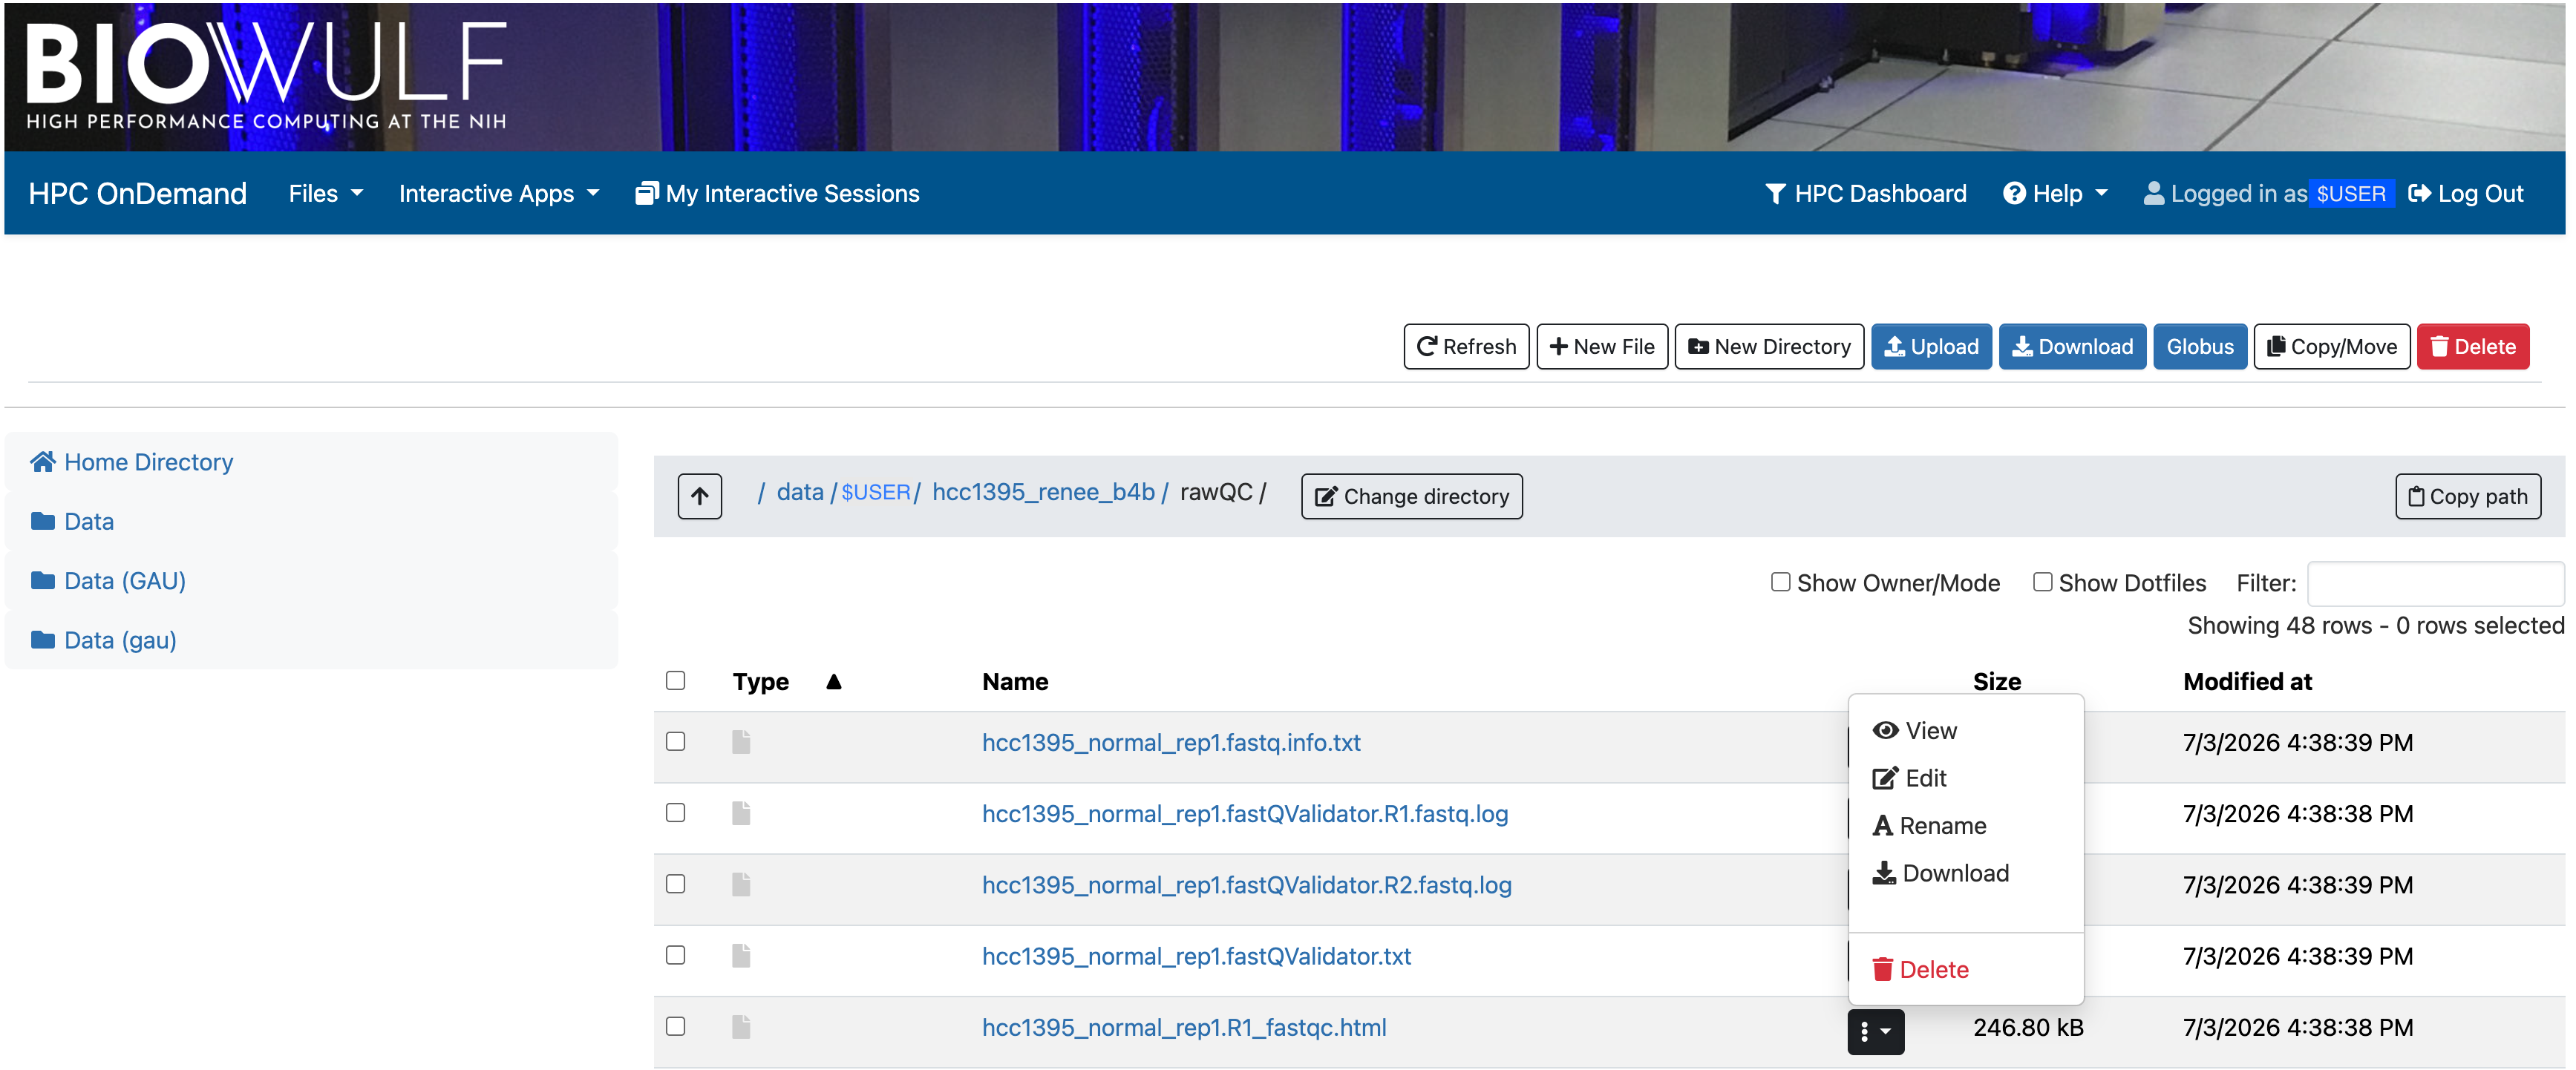
Click the drop down next to hcc1395_normal_rep1.R1_fastqc.html to download it on to local computer to learn what is inside a FastQC report.
Components to a FastQC Report
Upon opening a FastQC report, users will see a navigator menu that links to different sections of the report. In addition, there is a basic statistics table. This table contains the information below.
- Name of the FASTQ file in which the report was generated for (hcc1395_normal_rep1.R1 in this case)
- The number of sequences in the file.
- Number of sequences flagged with poor quality.
- The sequence length (ie. how many bases are in each sequencing read of the FASTQ file).

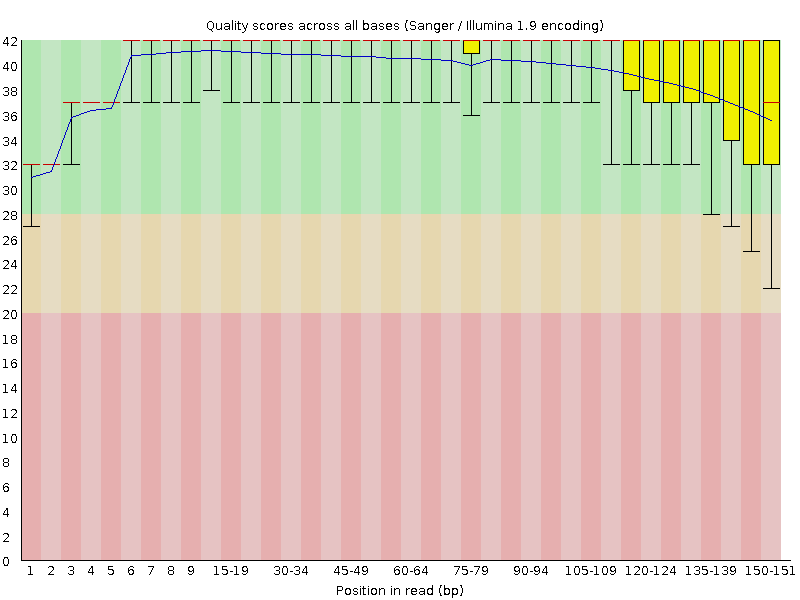
To not be exhaustive, this class will point out two important quality metrics in the FastQC report. First, there is the "Per base sequence quality" plot, which plots the error likelihood at each base position averaged over all sequences in a FASTQ file.
-
On the vertical axis are the quality scores that are in row 4 of the sequencing reads in a FASTQ file. These quality scores represent error probabilities, where:
- 10 corresponds to 10% error (1/10),
- 20 corresponds to 1% error (1/100),
- 30 corresponds to 0.1% error (1/1000) and
- 40 corresponds to one error every 10,000 measurements (1/10,000) that is an error rate of 0.01%
-
The three colored bands (green, yellow, red) illustrate the typical labels assigned to these measure:
- reliable (28-40, green)
- less reliable (20-28, yellow)
- error prone (1-20, red)
-
The yellow boxes contain 50% of the data, the whiskers indicate the 75% outliers.
-
The red line inside the yellow boxes is the median quality score for that base.
-
The blue line is the average quality score at a particular base.
Then, if there is adapter contamination in the sequences. This example shows that the raw FASTQ file contains adapter contamination.
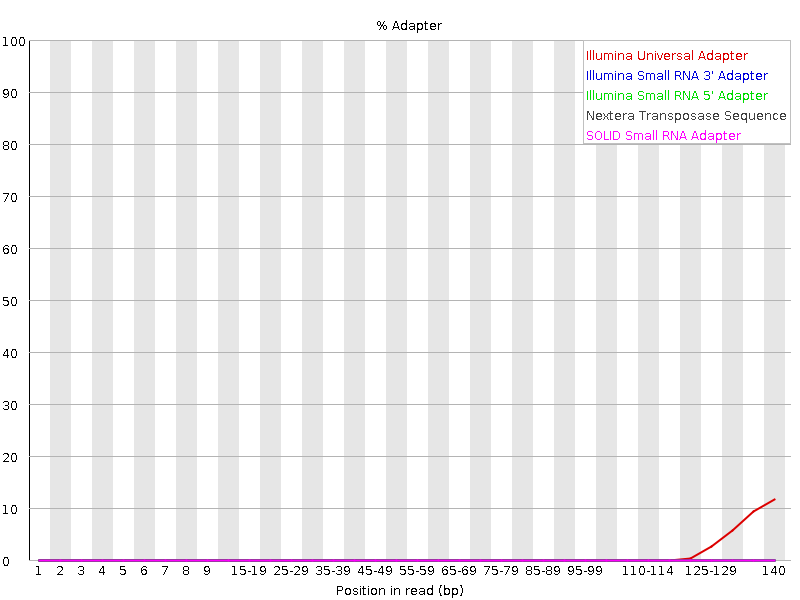
The quality of and whether there are adapter contamination in the sequences are important QC metrics because:
- Scientists would want high quality sequences (ie. those that have low likelihood for error).
- Sequencing adapters interfere with identifying where in the genome each read came from.
There are other metrics in a FastQC report. Please see https://www.bioinformatics.babraham.ac.uk/projects/fastqc/ to learn more.
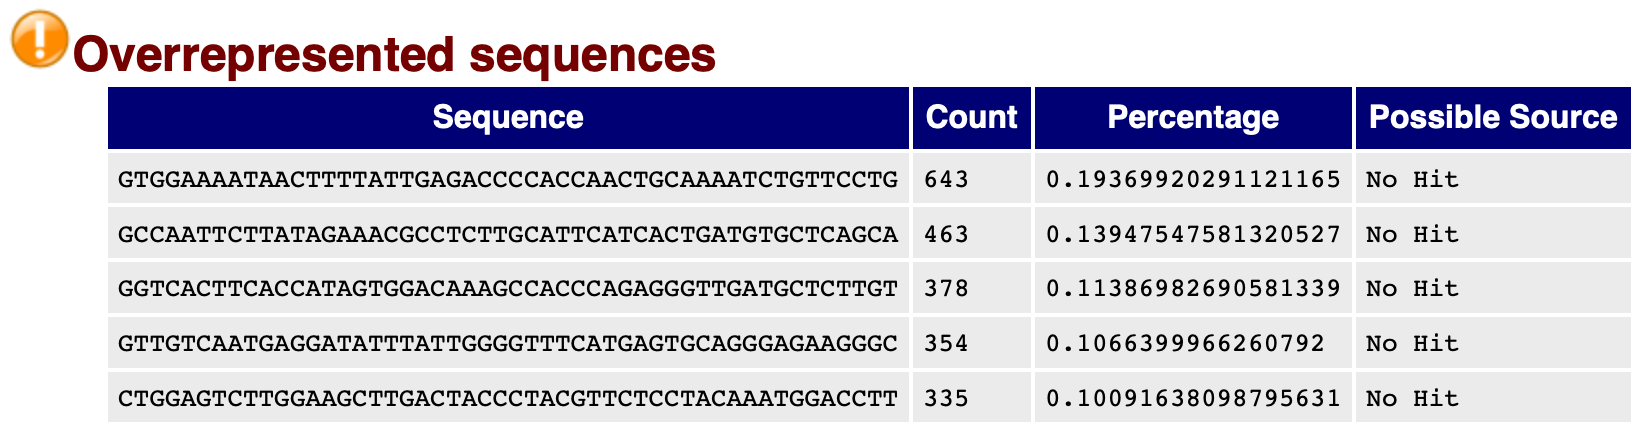
The presence of over represented sequences may indicate adapter contamination, low complexity sequencing library, or other artifacts. FASTQC will trigger a warning when the content of over represented sequences are more than 0.1%. Failure occurs when the content of overrepresented sequences is more than 1%.
MultiQC
Because FastQC generates quality metrics for each FASTQ file in a study, it becomes inefficient to interrogate QC metrics. MultiQC is a tool that can merge individual FastQC reports as well as enable the inclusion of things such as alignment metrics and other quality measures that are important in Next Generation Sequencing. MultiQC generate interactive html reports. Similar to the FASTQC report, users have quick access to different portions of the MultiQC report via a navigation panel on the left.
General Statistics Table
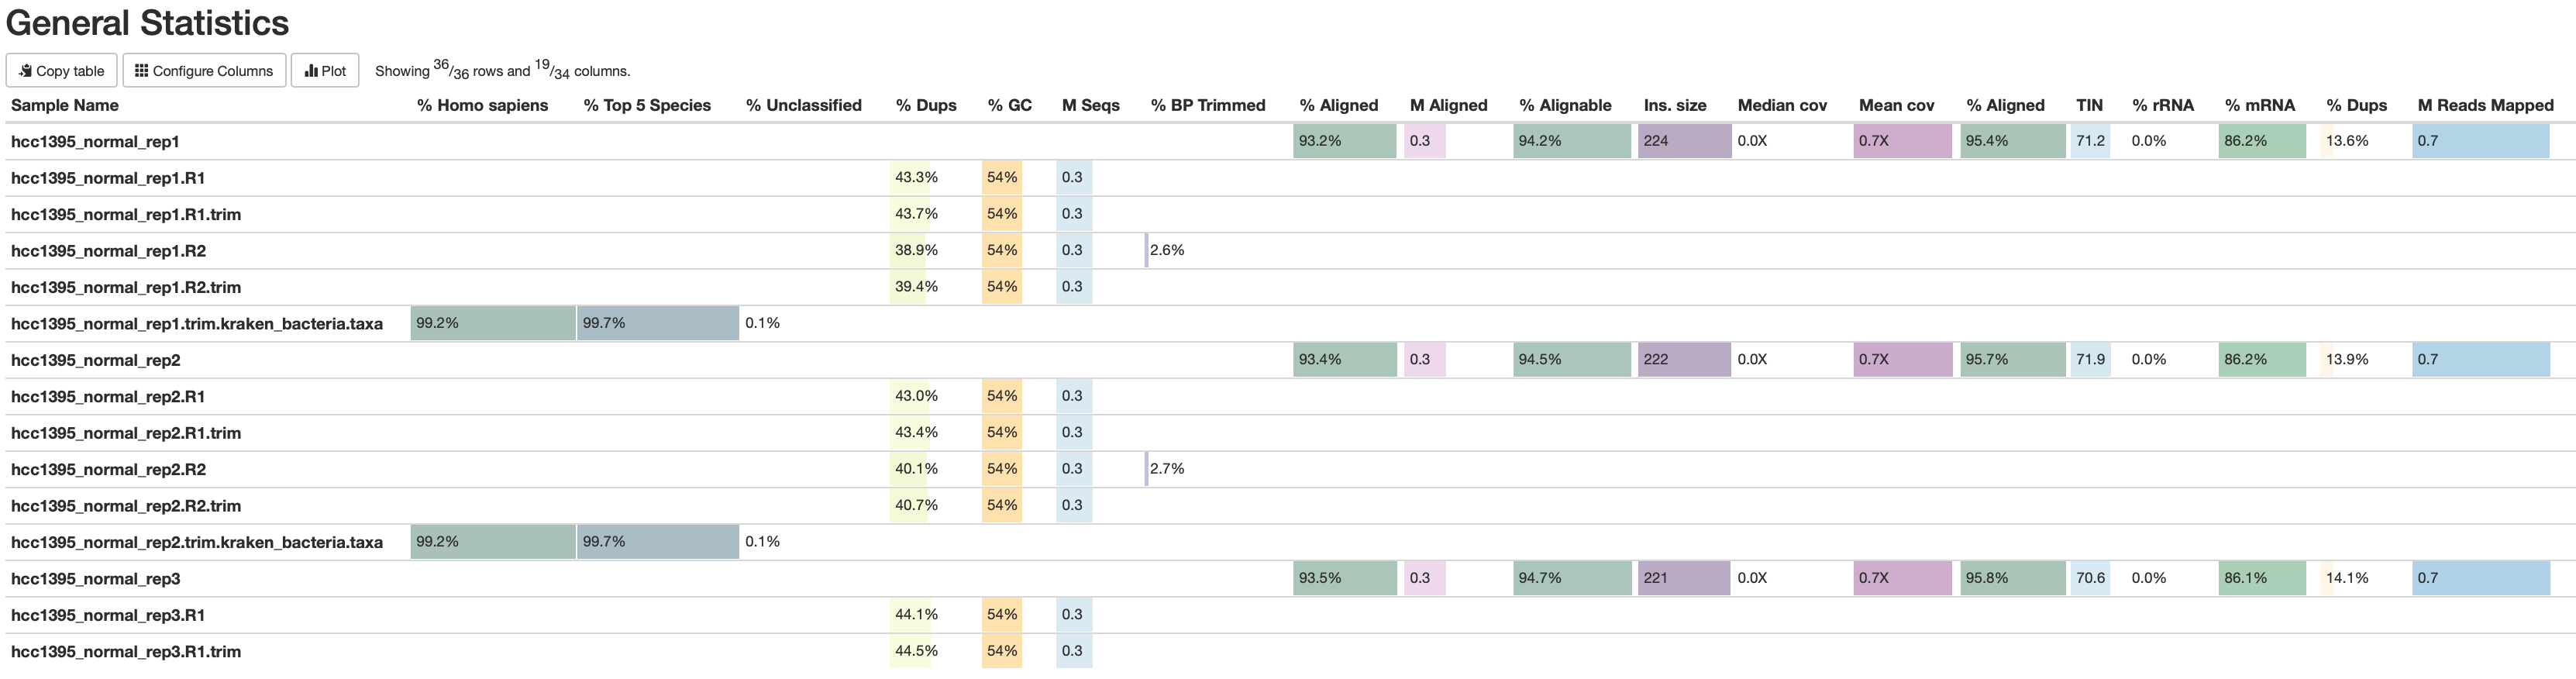
The first item in the MultiQC report is a table that summarizes sample level QC metrics. The information here varies by analysis. The information in this table include the following.
- Whether there is genetic contamination from species that are not of interest. This is a human study, so it is expected that the sequencing reads for the most part will map to the human genome even though some reads may map to different species due to conservation. Here, over 99% of reads in each sample map to human while an additional small percentage map to other species. This provides one level of confidence that the data is sound.
- Information about the sequences:
- %Dup shows the percentage of duplicate sequences found in each sample. Here, the duplication rates for the samples are approximately 40%, which will raise a flag in FASTQC (see FASTQC section on duplication). When it comes to RNA sequencing, duplicate reads can be biological meaningful as there could be many copies of a transcript. However, duplication could also indicate artifact generated during PCR amplification or low complexity library.
- %GC contains the GC content for each sample. Ideally, this should be same as the GC content for the specie's genome.
- The subsequent columns summarize downstream analysis results, including the STAR alignment rate, coverage-related metrics, and RSEM mapping or assignment rates. These metrics help assess how well the reads align to the reference genome and how effectively they are used for transcript-level quantification.
MultiQC aggregates the sequencing quality histogram generated by FASTQC for each sample. The per base qualities for untrimmed and trimmed FASTQ files are available on the same plot.

The adapter content for both the untrimmed and trimmed sequences are aggregated in the MultiQC report as well. Note that prior to trimming, this module failed (ie. 12 FASTQ files contain sequences with adapter read through).
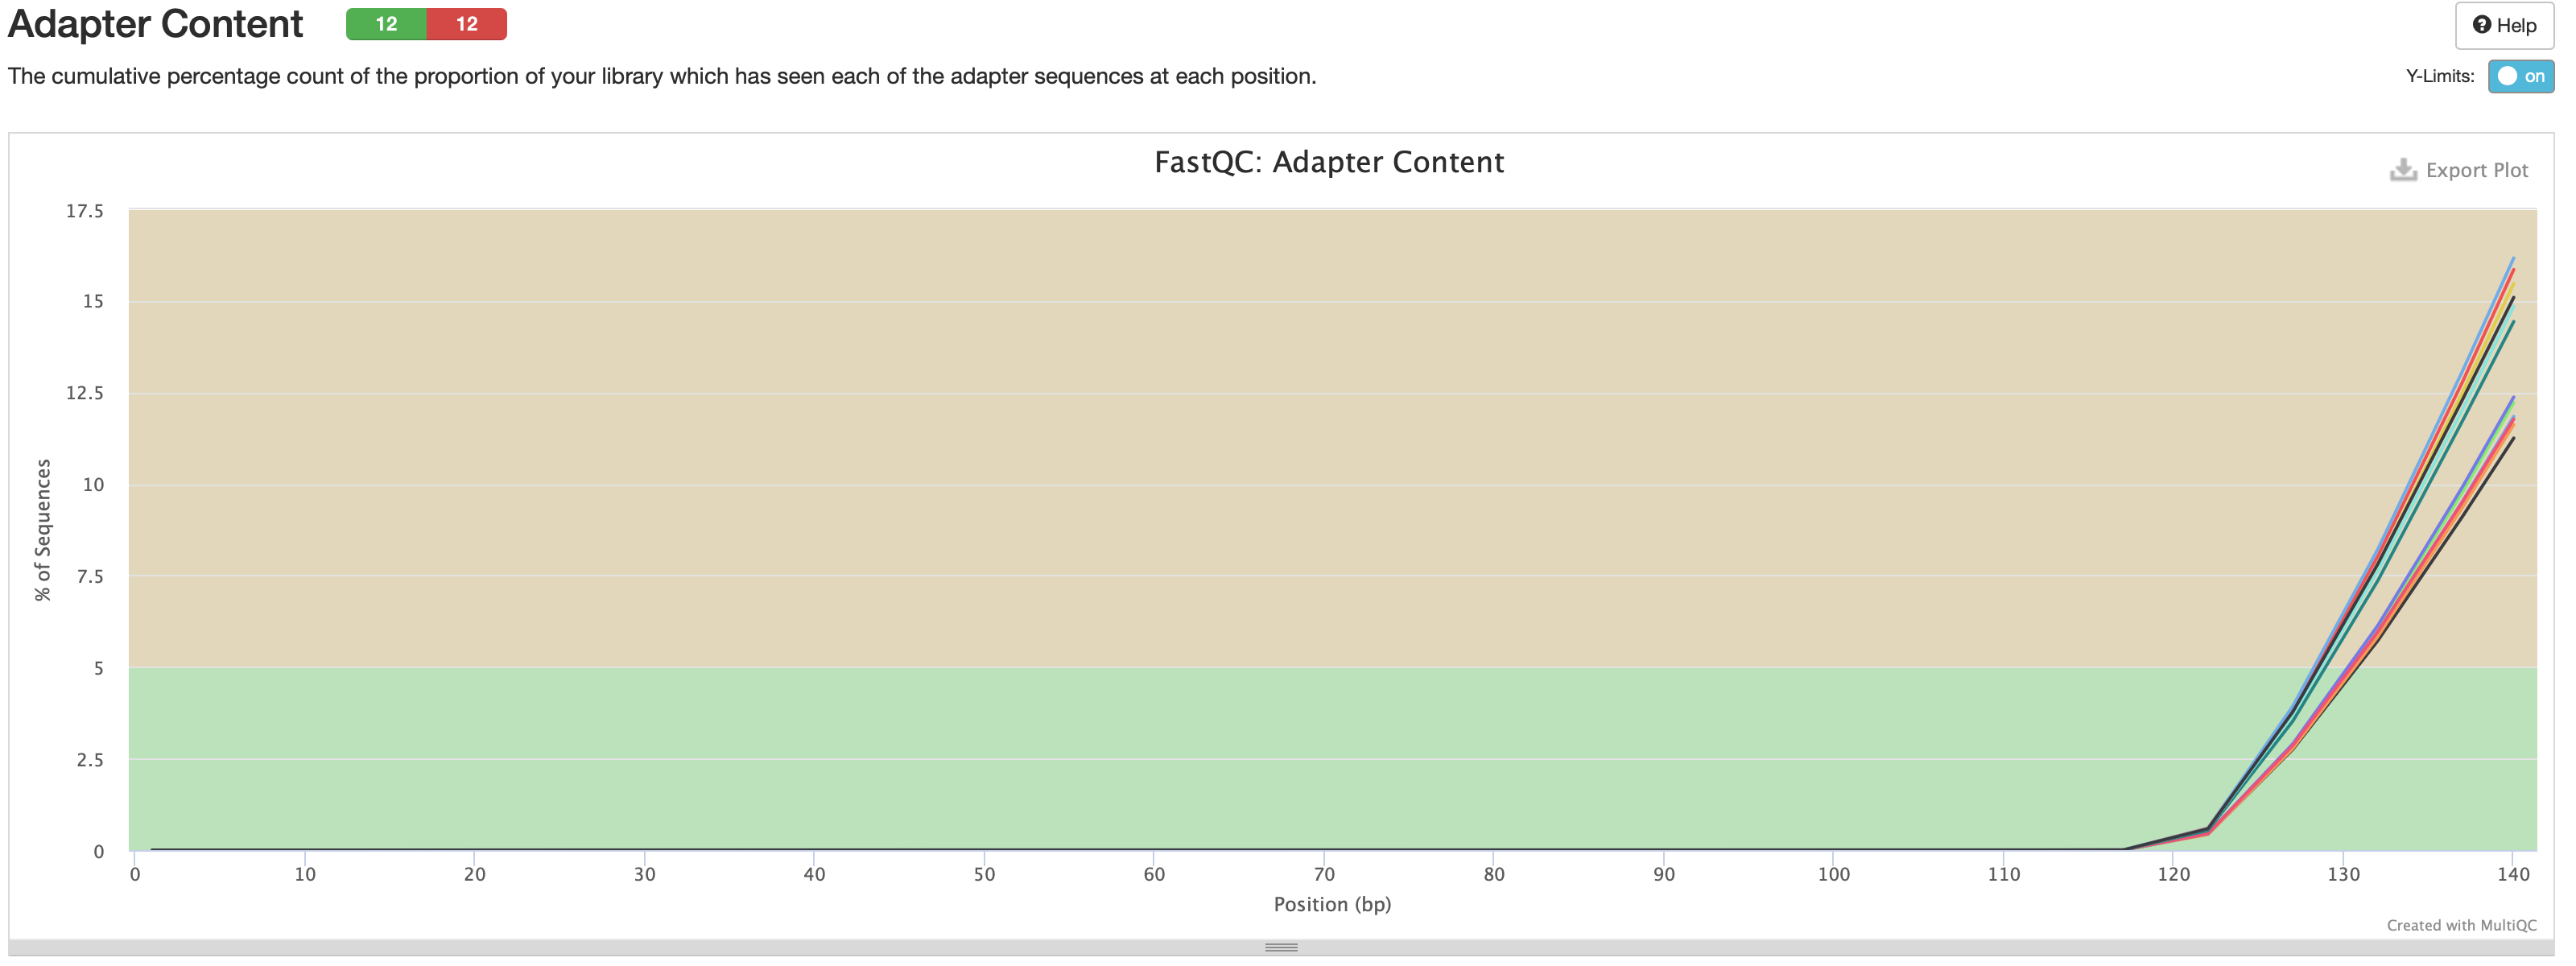
Looking at all samples in a MultiQC plot can be inundating. The filter toolbox can be used to select and highlight those samples that the researcher wants to view.
To filter only those samples that the user wants to view, click on the "Toolbox". Enter the search patterns, click "+". When finished adding search patterns, click apply. MultiQC enables pattern search in regular expression or regex mode. See https://learn.microsoft.com/en-us/dotnet/standard/base-types/regular-expression-language-quick-reference for a list of regex patterns.
The following patterns will filter and highlight the QC metrics for the untrimmed normal and tumor FASTQ files. The normal samples will be highlighted in blue while tumor samples will be highlighted in orange. Users can select the color in the color drop down box. In the pattern below:
- The first part of the pattern is either
hcc1395_normalorhcc1395_tumor. - The following
.denotes matches anyone character and the*after says any number of occurences are allowed. Ris then added to signify read 1 (R1) or read 2 (R2), although there is no need to be explicit since the proceeding.tells MultiQC to grab any one character at the end of search pattern (denoted by$).
hcc1395_normal.*.R.$
hcc1395_tumor.*.R.$

Use the following regex patterns to filter out the normal and tumor untrimmed FASTQ adapter content plots. The \s in the search pattern denote spaces (\ serves as an escape for s so that the computer does interprets as a space rather than the letter s).
hcc1395_normal.*R.\s-\sillumina
hcc1395_tumor.*R.\s-\sillumina
Cutadapt Trimming
RENEE uses Cutadapt to remove adapter contamination from sequencing reads. The plot below from MultiQC shows the distribution of the number of reads trimmed from each FASTQ file. Most FASTQ files have 30 or less reads trimmed from them.

Click on the green box and select "Show only these samples" to see the adapter contamination information for the trimmed FASTQ files.

The adapter content plot dissappeared since the trimmed FASTQ files do not contain adapter contamination.

Other tools for trimming include
- Trimmomatic performs adapter and quality trimming for Illumina data.
- BBduk uses a kmer based algorithm for adapter and quality trimming.
Rationale for choosing Cutadapt in RENEE.
- Ability to better control adapter trimming.
- Higher reliability.
- Enables the fine tuning of error rates.
- Capability to handle many adapters at once.
- Actively maintained.
Note that post trimming, the quality of the sequences are still good (30 or above).
Enter the search pattern below to view the quality score histogram for the trimmed FASTQ files.
hcc1395_normal.*trim$
hcc1395_tumor.*trim$

Checking for Genomic Content from Other Species
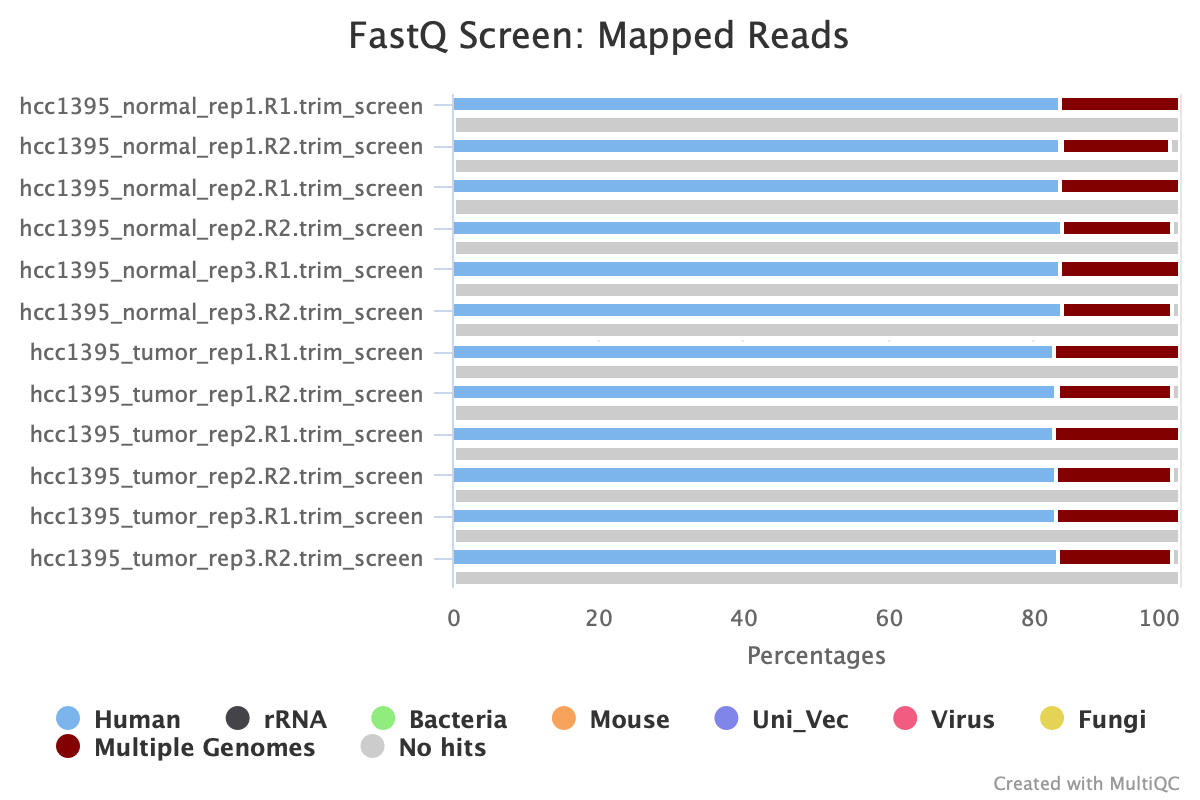
RENEE uses two software to check whether there are potential genomic contamination from species that are not of interest in the study. For instance, a human bulk RNA sequencing study should generate sequences that map to the human genome. These tools are Kraken and Fastqscreen(target=_blank). Fastqscreen allows scientists to compare their next generation sequencing data to a database (think of BLAST). On the other hand, Kraken is a taxonomic classification system. As shown in the general statistics table, it is unlikely that there is contamination from non-human genomic content.
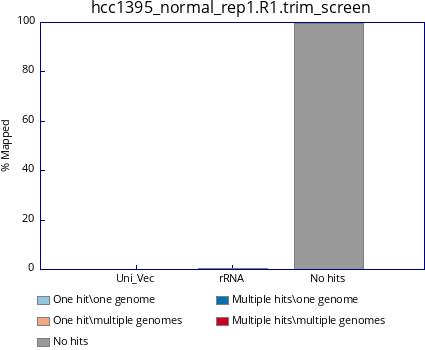
Note that there are two Fastqscreen plots per trimmed FASTQ file. The genomic hits from other species are on the top graph. The bottom reports matches to Uni_vect and ribosomal RNA (rRNA) hits. Uni_Vec is a database that houses sequences for vectors, adapters, linkers, and primers. There traces of hits to rRNA sequences but none for Uni_vec.
Navigate to the FQscreen and FQscreen2 folders to take a look at the single sample reports. In terms of genomic content from other species, the plot below shows that 100% of the sequences in this study match humans. Due to things like conservation, less than 20% match that for mice.
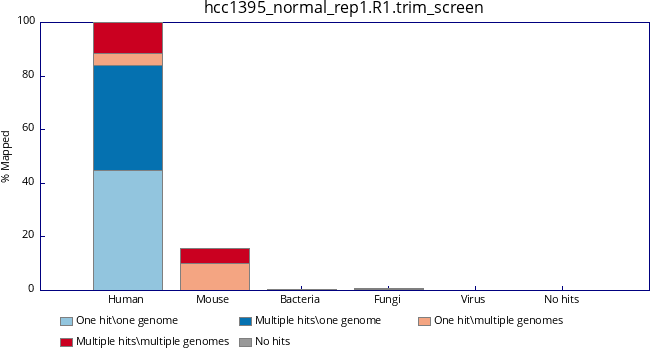
The same sample shows no contamination from Uni_vec but some from rRNA while almost 100% of the sequences returned to hits when compared to those databases.