Lesson 11: Pathway Analysis and Pre-ranked GSEA with iDEP
Learning Objectives
By the end of this lesson, learners should be able to:
- Identify the pathway analysis methods available in iDEP and the general category (ORA, FCS, or single-sample scoring) each belongs to;
- Run DEG functional enrichment and Pathway tab analyses in iDEP, and navigate the resulting tables, trees, networks, heatmaps, and KEGG diagrams;
- Accurately interpret enrichment and pathway analysis results, including common pitfalls in iDEP's output columns, without overstating biological significance;
- Evaluate when iDEP's tools are sufficient for a given question versus when to use another tool.
Version Differences with iDEP
While Biowulf is restricted to iDEP v2.01, the current iDEP web application is v2.5.0. The latest version includes many UI improvements that make it easier to run, explore, and interpret pathway results. I recommend the latest version of iDEP for the most up-to-date features and user experience. The Biowulf version is still functional and will be used for this lesson, but the screenshots and instructions may differ slightly from the current web application. If you are using the current iDEP web application, please refer to the official documentation for any differences in workflow or output.
What Functional Enrichment / Pathway Analysis Is Available in iDEP?
iDEP offers both Over-Representation Analysis (ORA) and Functional Class Scoring (FCS) methods, as well as single-sample scoring and visualization. Here's a quick overview of the main options:
- Functional Enrichment - iDEP uses functional enrichment to perform ORA on a list of significant DE genes. It counts overlaps with gene sets from GO, KEGG, and other databases, and tests for over-representation against a background via hypergeometric distribution. "For the selected contrast, you can run GO, pathway, and TF/miRNA target enrichment" (iDEP Internal Documentation). Functional enrichment analysis is also available post clustering with k-means (See the Cluster tab) or biclustering (See the Bicluster tab). Note: the recommended sample size for biclustering is 15 or more samples and more than 2 experimental conditions.
-
Pathway Analysis - iDEP offers several FCS methods or single-sample scoring methods that use the full ranked list of genes or the full expression matrix to test whether a pathway's genes show coordinated shifts. These include GAGE, GSEA/fgsea, PGSEA, ReactomePA, GSVA, ssGSEA, and PLAGE.
-
GAGE (FCS method) - GAGE takes fold-change values (or expression values) for all genes, not just a thresholded list, and uses a two-sample t-test-style comparison to ask whether a pathway's genes show a coordinated shift. It can test up- and down-regulated genes separately, which is why iDEP lets you filter by direction on the Network tab. It is conceptually closer to PAGE than to rank-based GSEA. Asks the question: "Averaged across my two groups, did this pathway's genes shift together more than we'd expect by chance?"
-
GSEA (fgsea, FCS method) — iDEP's fgsea implementation orders all genes by fold change and asks whether a pathway's members cluster toward either end of that ranking, using the same running-sum/permutation logic as the original GSEA software, just a faster implementation. Asks the question: "Are this pathway's genes enriched at the top or bottom of my ranked list?"
-
PGSEA (FCS method) - PGSEA computes a per-sample (or per-comparison) summary statistic for each pathway rather than pooling all samples into one group-level test, which is why "PGSEA w/ all samples" gives you a full sample × pathway matrix suitable for clustering. It's parametric (t-test/z-score based, in the same family as PAGE) rather than permutation-based like GSEA. Asks the question: "In this sample, is this pathway shifted up or down relative to the average sample in my dataset?"
-
ReactomePA (FCS method, rank-based GSEA) - functional enrichment scoped specifically to Reactome's pathway hierarchy rather than a generic gene set collection. iDEP runs it via ReactomePA's
gsePathway, which ranks all genes by fold change and applies the same permutation-based running-sum logic as fgsea. The pathway relationship plots it produces are a good way to see how Reactome's mechanistic pathway structure (as opposed to GO's simpler term hierarchy) groups related processes. Asks the question: "Within Reactome's curated pathway hierarchy, do the genes in this pathway pile up at one end of my fold-change ranking?" -
GSVA / ssGSEA / PLAGE (Single-Sample Gene Set Scoring) - Instead of testing whether a pathway is enriched in one comparison (treatment vs. control), these methods first transform your entire expression matrix into a new matrix of per-sample pathway scores — one score per sample, per gene set. That's exactly why they're well suited to comparisons across multiple groups or timepoints. iDEP then runs a per-pathway ANOVA on these scores across your groups (equivalent to a t-test for two groups), FDR-corrects the p-values, and displays the top significant pathways as a heatmap of scores. Note: GSVA-based results are considered unreliable with 10 or fewer total samples (at least 6 samples are recommended by iDEP). Asks the question: "What is this sample's own activity level for this pathway, and does that score differ significantly across my groups?"
-
Pathview (Visualization) — not an enrichment method at all, but a visualization layer. When you select KEGG in iDEP and choose Pathview, it takes your fold-change values and overlays them directly onto the official KEGG pathway diagram for whichever pathway you're inspecting, colored by direction and magnitude of change. Use it after ORA, GAGE, or GSEA has told you which pathway is interesting, to see where in that pathway the changes are concentrated.
-
Pathway Topology (PT) Methods
None of iDEP's built-in options are true Pathway Topology (PT) tools. PT methods like SPIA or iPathwayGuide aren't part of the standard iDEP workflow, so if network topology matters for your question, you'll need to look outside iDEP.
WGCNA
iDEP also offers Weighted Gene Co-expression Network Analysis (WGCNA), which doesn't fit any of the four categories above. Rather than testing a predefined gene set against your data, WGCNA finds its own gene groups ("modules") by clustering genes that are correlated across your samples, then checks whether any module tracks with your trait of interest. It's a data reduction/discovery method, not an enrichment test. The two connect naturally, though: once WGCNA hands you a module of interest (a data-derived gene list), you can run that list through ORA to find out what it's biologically about.
Two Places to Start
Upload Fold Changes and Adjusted P-values
For this approach, you'll upload a table of fold changes and adjusted p-values for your genes, rather than the full expression matrix. This is suitable when you already have differential expression results and want to focus on pathway-level interpretation. We can take our output from Lesson 9 and use it to explore pathway enrichment without reprocessing the raw expression data.
- Download these data here: DEG_Results_2.csv
Changes to the iDEP DEG Output Table
When you import data in iDEP, the gene ID column is automatically converted to Ensembl IDs. Therefore, only the User_ID column, which contains the original Ensembl IDs, were included in DEG_Results_2.csv. This was to avoid Gene ID conversion issues when uploading to iDEP. The processed data were also excluded, as these are not needed for pathway analysis.
Once the data is uploaded, move to the DEG1 tab to select an FDR cutoff and minimum fold-change threshold for defining differentially expressed genes. The enrichment analysis in the DEG2 tab will use the resulting gene lists to identify over-represented pathways and gene sets.
(OUR STARTING POINT FOR THIS LESSON)
Expression matrix
If you upload only fold changes and adjusted p-values (rather than the full expression matrix), PGSEA, PGSEA w/ all samples, GSVA, ssGSEA, and PLAGE will not be available, since these methods require per-sample expression values to compute per-sample pathway scores. GAGE, GSEA (fgsea), and ReactomePA can run from fold-change data alone.
Upload Expression Matrix and Sample Design
Proceed from the workflow from Lesson 9. Here we would start with our full expression matrix and the corresponding sample design and run the Stats step to generate fold changes and p-values. This is suitable when you want to explore pathway-level interpretation directly from the raw expression data, allowing for more flexibility in analysis and visualization.
- Download the expression matrix here: rsem_modified.txt
- Download the sample design here: Design.csv
Proceed through the workflow as outlined in Lesson 9, generating differential expression results before moving on to pathway analysis.
Before opening pathway tools, confirm:
- the data and sample design were uploaded and preprocessed;
- Stats was run (in the DEG1 tab);
- the active contrast is
Tumor-Normor the intended comparison; - the direction of log2FC is understood.
TrainingData
The teaching data set is from https://rnabio.org/. It is a practice set with 3 replicates of data from the HCC1395 breast cancer cell line and 3 replicates of data from HCC1395BL matched lymphoblastoid line, making a tumor vs normal comparative dataset. Importantly, this dataset has been pre-filtered to chromosome 22 only. Because of that, the pathway results will be limited and will likely not reflect the biological context.
DEG Functional Enrichment
Functional enrichment of DEG up and downregulated genes helps identify biological processes, pathways, and functional categories that are over-represented in your lists. This analysis is available in the DEG2 tab under Enrichment. Remember, ORA is sensitive to the user's choices of FDR and fold-change thresholds, so be sure to consider the implications of your filtering choices on the resulting gene lists.
Under Enrichment you will find tabs for Pathways, Tree, Network, Plot, Genes, and Details. Key points from the iDEP documentation are summarized below:
- P-value calculation: One-sided hypergeometric test, adjusted for multiple testing via Benjamini-Hochberg, reported as FDR
- FDR interpretation: Likelihood the enrichment is due to chance; larger pathways tend to get smaller FDRs simply due to greater statistical power
- Fold Enrichment (Effect size measure): % of gene list belonging to a pathway divided by the % of background with that pathway; shows magnitude of over-representation.
- Background gene set: Includes filtered genes from the original list (i.e., genes passing the low-count filter in RNA-seq)
- Redundant pathway handling: Pathways sharing ≥90% of genes AND ≥50% of words in the pathway name are collapsed, represented by the most significant pathway.
To begin your analysis:
- Open the Enrichment view.
- Run enrichment separately for:
- up-regulated genes;
- down-regulated genes.
- Enable
Use filtered genes as background. Remember that the background is the set of genes that could have been detected as DE, not all genes in the genome. This is important for accurate enrichment results. - Use
Remove Redundant Gene Setsfor a cleaner view. - Start with a manageable number of top pathways, such as 10 to 20.
- Export the CSV table.
Choosing Gene Sets and Databases
Your scientific question will guide which gene sets and databases are most relevant for your analysis. For example, if you are interested in transcriptional regulation, you may want to focus on transcription factor target gene sets. If you are interested in signaling pathways, you may want to focus on KEGG or Reactome pathways. If you are interested in TF binding motifs, you may want to focus on the Motif gene sets from MSigDB.
Results Interpretation
Pathways table
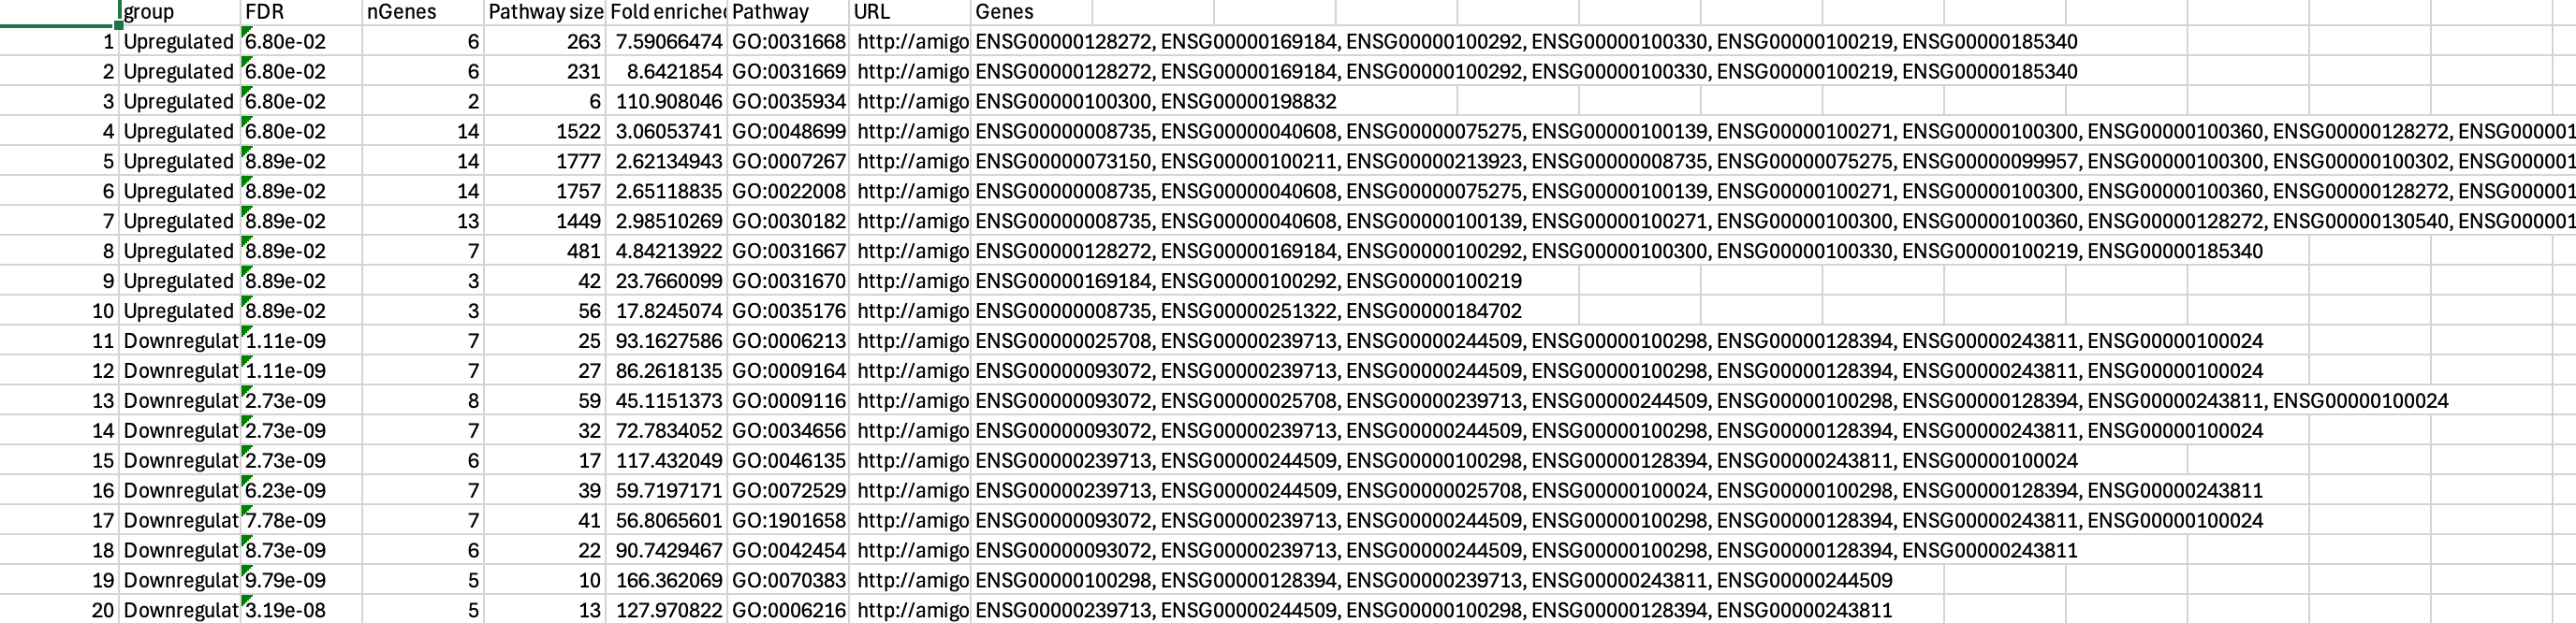
The pathways table summarizes the enriched pathways, including statistics such as the adjusted p-value, fold enrichment, and the pathway name, which is clickable for more information. This table is the starting point for interpreting functional enrichment results. You should download the table as a CSV file for further analysis and record-keeping.
"Fold Enrichment is defined as the percentage of genes in the list belonging to a pathway, divided by the corresponding percentage in the background. As a measure of effect size, Fold Enrichment indicates how drastically genes of a certain pathway is overrepresented." - Internal iDEP Documentation
The downloaded CSV file will include additional columns such as the number of genes in the overlap, the pathway size, and the genes from our DEG list that were in the pathway.
Tree and Network
The hierarchical clustering tree and network graph can be used to assess the relationship between enriched gene sets and pathways. Both are based on a distance metric derived from the percentage of overlapped genes between terms. The tree shows the hierarchical relationships among enriched terms, while the network graph visualizes the connections between pathways based on shared genes. Many of these gene sets are likely to be related or redundant, so these visualizations help identify clusters of related terms.
We can reduce redundancy by selecting the Remove Redundant Gene Sets option, which will help focus on the most informative terms.
Plot
Here we can create a lollipop plot, dot plot, or bar plot to visualize the top enriched pathways. The plot can be customized to show different statistics, such as adjusted p-value, fold enrichment, or gene count. This visualization helps to quickly identify the most significant pathways and their relative importance in the context of the analysis.
Genes/Details
The Genes tab lists the down and / or up-regulated genes that went into our analysis. It includes gene identifier and annotation information, as well as the location, type, and description of the gene. The Details tab provides information about the analysis that was run.
Do not over-interpret pathway results.
Pathway enrichment results indicate associations between gene lists and annotated pathways. They do not prove causal activation or inhibition of the pathways. Interpret the results as suggestive rather than definitive. These results should be used to generate hypotheses for further experimental validation.
Pathway Analysis
Under the Pathway tab, you can run GAGE, GSEA/fgsea, PGSEA, ReactomePA, GSVA, ssGSEA, or PLAGE. These methods consider the data from all genes regardless of user defined DEG thresholds. Each method has its own strengths and weaknesses, and the choice of method will depend on your scientific question and the characteristics of your data. Check out iDEP's documentation for more information on the methods and databases available: https://idepsite.wordpress.com/pathways/.
P-hacking
Pathway analysis is sensitive to the choice of method, gene set database, and parameters. Avoid trying multiple methods and databases until you find a significant result, commonly known as p-hacking. Instead, choose a method and database that are appropriate for your scientific question and stick with it. If you want to compare methods, do so systematically and report all results. Comparing results from different methods can be informative, and in some cases can be used to support a finding, but it should be done in a transparent and reproducible manner. For example, consider comparing GSEA results to earlier functional enrichment results to see if many of the same pathways are identified.
To run a pathway analysis, follow these steps:
- Select the same comparison used in DEG (if proceeding from DGE workflow).
- Choose a pathway analysis method, e.g.,
GSEA (preranked fgsea). - Choose a gene-set / pathway database. A good starting point is KEGG, Reactome, or GO Biological Process.
- Set the pathway FDR cutoff (e.g., 0.05). This is the threshold for significance.
- Check gene-set size limits.
- Click Submit.
- Inspect Significant pathways, Tree, Network, Heatmap, and KEGG tabs as available.
Gene Set Enrichment Analysis (GSEA) / fgsea
We are using the fgsea implementation of GSEA in iDEP for a demo. GSEA is a popular rank-based method that tests whether a predefined set of genes shows statistically significant, concordant differences between two biological states.
Ranking metrics
GSEA ranks genes by a metric that reflects their differential expression between two conditions. iDEP uses the log2 fold change from the DEG analysis. GSEA results are sensitive to the choice of the ranking metric. See a summary of common ranking metrics here. Unfortunately, the least robust choice is generally a raw FC (the default in iDEP with no other alternatives). Better choices include the test statitic (e.g., t-test statistic, Wald test statistic from DESeq2, Signal-to-Noise Ratio) or signed -log10(p-value), though the latter requires correction.
Gene set size limits
GSEA results can be influenced by the size of the gene sets. The normalization of enrichment scores is "not very accurate for extremely small or extremely large gene sets. For example, for gene sets with fewer than 10 genes, just 2 or 3 genes can generate significant results.".
Other reasons for limiting large gene sets include:
- The run time of the analysis will increase with larger gene sets.
- Large gene sets are more general and therefore, more difficult to interpret.
- "The GSEA null hypothesis is that the set is distributed uniformly at random along the gene ranking. For larger, structured gene sets that tends to be the case, even when there is no biological significance. In particular, artifacts from gene-gene expression correlation start to play an important role. --- Alexey Sergushichev, FGSEA author
Settings to control with iDEP:
Pathway significance cutoff (FDR): filters results to pathways with adjusted p-values at or below the chosen threshold. More options: reveals extra sliders/toggles such as gene-set size limits, number of top pathways to show, and the gene-level FDR filter applied before analysis. Gene-set size (Min/Max): exclude sets that are too small (often noisy) or too large (overly generic).
Number of top pathways: controls how many entries appear in the summary tables and plots.
Remove genes with big FDR: discards genes whose Stats adjusted p-values exceed the specified threshold before pathway scoring.
Use absolute values of fold changes: treats up- and down-regulation equally (useful for pathways where mixed regulation indicates activation, such as signaling cascades).
Show pathway IDs: appends identifiers (for example, GO terms or KEGG IDs) to pathway names in the output.
Report: download an HTML report of the results.
PGSEA color palette: when using PGSEA, choose the color scheme applied to the sample-by-pathway heatmap. - IDEP Internal Documentation
Results
iDEP returns a table of significant pathways / gene sets, a tree diagram of related terms, a network graph of related terms, and a heatmap visualizing the expression of genes driving each pathway. The heatmap is more relevant if proceeding to this analysis from the full expression matrix rather than the DEG results. There is also a KEGG tab that shows a pathway diagram via Pathview, if KEGG is selected as the database for the analysis.
Pathview Integration
There were no significant pathways from KEGG in the teaching dataset. To see how this option works, you can use a demo dataset from the iDEP website.
A colored KEGG diagram is a visualization of gene-level changes on a pathway map. It does not prove flux, protein activity, phosphorylation, or causal pathway activation.
iDEP does not provide a by pathway enrichment plot.
Significant Pathways Table
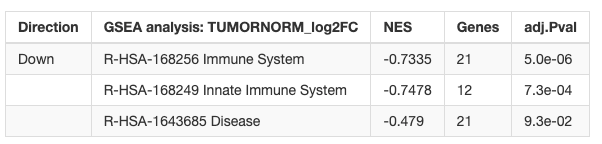
The significant pathways table provides the direction, pathway, NES (normalized enrichment score), Genes, and adjusted p-value (FDR). The NES is a normalized version of the enrichment score that accounts for differences in gene set size and correlations between gene sets. This allows comparability across different gene sets. Genes are the number of genes in the ranked list that are in the pathway. The adjusted p-value (FDR) is the false discovery rate, which is a measure of the expected proportion of false positives among the significant pathways.
Example following GSEA with Curated.Reactome:
 .
.
Column Names
The column names in the iDEP output are neither intuitive nor well-documented. The description of "Genes" here was gained from the code.
Leading Edge Genes
The leading edge genes are the subset of genes that contribute most to the enrichment score of a pathway. These are not included as output for the GSEA results in iDEP, but they can be obtained by running GSEA outside of iDEP. The leading edge genes are important for understanding which genes are driving the enrichment of a pathway and can provide insights into the underlying biology.
Example Interpretation of Results
Remember not to overstate results. The following is an example of how to interpret the results from GSEA with GO BP:
"Gene set enrichment analysis (fgsea) comparing tumor versus normal samples identified several immune-related Gene Ontology Biological Process terms as significantly downregulated in tumor samples, including "immune response" (adj. p = 2.8e-04) and "innate immune response" (adj. p = 0.032). These results may suggest reduced coordinated expression of immune-related gene sets in tumor tissue relative to normal."
Common Troubleshooting
| Symptom | Likely issue | Trainer response |
|---|---|---|
| Pathway tab has no contrast | Stats was not run or no contrast selected | Return to Stats and run the comparison |
| Few pathways are significant | Strict FDR/gene-set size filters, weak signal, poor ID mapping | Check mapping, relax cutoffs cautiously, inspect ranked results |
| Many generic GO terms dominate | GO redundancy and broad parent terms | Use redundancy removal, tree/network views, or a more focused database |
| KEGG tab is empty | KEGG database not selected or unavailable | Select KEGG first and rerun |
| Up/down interpretation is confusing | Contrast direction unclear | Revisit Tumor-Norm direction and log2FC sign |
| Different methods return different pathways | Different null hypotheses and inputs | Treat as a comparison exercise, not a failure |
Beyond iDEP
iDEP is a strong teaching tool because DEG and pathway analysis live in the same interface. However, for a deeper analysis, especially when considering GSEA and the data not included (See R tutorial here for a comparison of expected results), consider using other tools that offer more flexibility, additional databases, and advanced visualization options. Find a few popular options below, and explore their documentation to see which best fits your needs:
| Tool | Why use it |
|---|---|
| Broad GSEA | Full-featured GSEA workflows and MSigDB integration |
| Enrichr | Fast exploratory enrichment across many libraries |
| g:Profiler | Convenient multi-organism enrichment and ID mapping |
| Reactome Pathway Browser | Curated pathway hierarchy and diagrams |
| clusterProfiler | Reproducible R-based GO, KEGG, Reactome, and GSEA workflows |
| DAVID | Classic ORA and functional annotation clustering |
| Cytoscape EnrichmentMap | Network visualization of enrichment results |
Resources Used
iDEP
- iDEP current web application and embedded documentation: https://bioinformatics.sdstate.edu/idep/.
- iDEP pathway analysis documentation: https://idepsite.wordpress.com/pathways/.
- Ge SX, Son EW, Yao R. 2018. iDEP: an integrated web application for differential expression and pathway analysis of RNA-Seq data. BMC Bioinformatics. https://doi.org/10.1186/s12859-018-2486-6.
Method-specific papers
- Luo W, Friedman MS, Shedden K, Hankenson KD, Woolf PJ. 2009. GAGE: generally applicable gene set enrichment for pathway analysis. BMC Bioinformatics. https://doi.org/10.1186/1471-2105-10-161.
- Subramanian A et al. 2005. Gene set enrichment analysis: a knowledge-based approach for interpreting genome-wide expression profiles. PNAS. https://doi.org/10.1073/pnas.0506580102.
- Korotkevich G, Sukhov V, Sergushichev A. 2021. Fast gene set enrichment analysis (fgsea). https://doi.org/10.1101/060012.
- Furlotte NA. PGSEA: Parametric Gene Set Enrichment Analysis. Bioconductor. https://bioconductor.org/packages/PGSEA/.
- Yu G, He QY. 2016. ReactomePA: an R/Bioconductor package for Reactome pathway analysis and visualization. Molecular BioSystems. https://doi.org/10.1039/C5MB00663E.
- Hanzelmann S, Castelo R, Guinney J. 2013. GSVA: gene set variation analysis for microarray and RNA-Seq data. BMC Bioinformatics. https://doi.org/10.1186/1471-2105-14-7.
- Barbie DA et al. 2009. Systematic RNA interference reveals that oncogenic KRAS-driven cancers require TBK1. Nature. https://doi.org/10.1038/nature08460 (ssGSEA).
- Tomfohr J, Lu J, Kepler TB. 2005. Pathway level analysis of gene expression using singular value decomposition. BMC Bioinformatics. https://doi.org/10.1186/1471-2105-6-225 (PLAGE).
- Luo W, Brouwer C. 2013. Pathview: an R/Bioconductor package for pathway-based data integration and visualization. Bioinformatics. https://doi.org/10.1093/bioinformatics/btt285.
Databases
- Reactome database: https://reactome.org/
- reactome.db Bioconductor annotation package: https://bioconductor.org/packages/reactome.db/
- KEGG database: https://www.genome.jp/kegg/
General pathway analysis guidance
- Khatri P, Sirota M, Butte AJ. 2012. Ten years of pathway analysis: current approaches and outstanding challenges. PLOS Computational Biology. https://doi.org/10.1371/journal.pcbi.1002375
- Nguyen TM et al. 2019. Identifying significantly impacted pathways: a comprehensive review and assessment. Genome Biology. https://doi.org/10.1186/s13059-019-1790-4.
- Young MD et al. 2010. Gene ontology analysis for RNA-seq: accounting for selection bias. Genome Biology. https://doi.org/10.1186/gb-2010-11-2-r14
- Conesa A et al. 2016. A survey of best practices for RNA-seq data analysis. Genome Biology. https://doi.org/10.1186/s13059-016-0881-8
- Gene Set Analysis: A Step-by-Step Guide. https://pmc.ncbi.nlm.nih.gov/articles/PMC4638147/
- Bora A, McKenzie M, Ziemann M. 2026. Ten common mistakes that could ruin your enrichment analysis. PLOS Computational Biology. https://doi.org/10.1371/journal.pcbi.1014122
- GO enrichment analysis guide: https://geneontology.org/docs/go-enrichment-analysis/
- Pathway Commons GSEA primer: https://www.pathwaycommons.org/guide/primers/data_analysis/gsea/
- GAGE/Pathview RNA-seq pathway workflow: https://www.bioconductor.org/packages/devel/bioc/vignettes/gage/inst/doc/RNA-seqWorkflow.pdf
- EnrichmentMap documentation: https://enrichmentmap.readthedocs.io/
- GSEA-MSigDB documentation: https://docs.gsea-msigdb.org/.
Internal course material
- Lesson 9 (DEG workflow): https://bioinformatics.ccr.cancer.gov/docs/bioinformatics-for-beginners-2026/Module_3_DEG_Pathway/Lesson9
- GSEA ranking metrics: https://bioinformatics.ccr.cancer.gov/docs/btep-coding-club/CC2025/GSEA/GSEA/#choosing-a-ranking-metric
- GSEA vs. iDEP comparison (Coding Club): https://bioinformatics.ccr.cancer.gov/docs/btep-coding-club/CC2025/GSEA/GSEA/