Lesson 6: Alignment of Bulk RNA Sequencing Data
Lesson 5 Review
Lesson 5 introduced participants to quality control and cleanup (ie. removal of adapters and/or error prone reads) from bulk RNA data. After cleanup, it is time to determine where in the genome or transcriptome each sequence the samples came from in what is known as the alignment step.
Learning objectives
At the end of this session, participants will be able to describe tools for aligning bulk RNA sequencing data and interpret post alignment quality metrics.
Why Perform Alignment
Bulk RNA sequencing generates millions of short reads per sample. Alignment identifies where in the genome or transcriptome these reads came from. In short, this process takes each of the sequencing reads and identifies the most likely match along a genome or transcriptome. Think of BLAST. The challenge with bulk RNA sequencing is that sometimes reads map across exons (see figure below), which can be overcome by using splice aware aligners.

A sequencing read (red fragments) aligning two exons (e1 and e2). Modified from: https://training.galaxyproject.org/training-material/topics/transcriptomics/tutorials/rb-rnaseq/tutorial.html.
HISAT2 and Spliced Transcripts Alignment to a Reference (STAR) are two aligners for bulk RNA sequencing. RENEE uses the aligner STAR since some advantages include:
- Splice aware
- Ultra fast
- Accurate
- Able to detect unannotated splice junctions (ie. those that are not in the GTF), which preserves reads that were not mapped to annotated splice sites
There also pseudo-aligners that maps reads to transcript and performs quanitification at the same time. These include Salmon and Kallisto.
Common to all aligners are reference genome or transcriptome indices. The indices make mapping easier. Think of a library having different sections divided according to topic of the books. When searching for chemistry, there is no need to search starting from A, just start from C. Each aligner requires its own index.
SAM and BAM Files
Next Generation Sequencing alignment results are stored in SAM or BAM files. SAM stands for sequence alignment mapped and BAM files are just the binary and compressed version of these. RENEE keeps the BAM files from STAR alignment in the bams folder of the output directory, which in this class it is hcc1359_renee_b4b in the participants Biowulf data directory.
SAM Tools can be used to view and manipulate alignment results such as sorting, indexing, and subsetting to a specific chromosome. Grab an interactive session on Biowulf using sinteractive or launch a interactive terminal session through HPC OnDemand.
sinteractive
Then, module load samtools. There is a bam file for each sample.
Use the construct below to print the first line of alignment result in hcc1395_normal_rep1.star_rg_added.sorted.dmark.bam.
samtools: initiate SAM Tools tasks with this.view: a subcommand for viewing SAM or BAM output and is followed by the file that the user wants to view (ie.hcc1395_normal_rep1.star_rg_added.sorted.dmark.bam)- The result of
samtools viewis then sent via pipe (|) toheadwhere the-1option prints out the first line.
samtools view hcc1395_normal_rep1.star_rg_added.sorted.dmark.bam | head -1
K00193:38:H3MYFBBXX:4:1121:15352:28970 355 chr1 177500 0 148M3S = 177500 148 TATGGATACGGCAGAAGAAAACATGAGGATTTCACAGATTTAAGGTGCAAAAAGTCACTGGGTTCTCTAAGAAGCCTGGGATTCTTCTGCTGGAAAAATAAGTTTGTTGAGAAAAAATGAGTTGGAGGAGGCTGTTATTGAAGTGAAGAGA AAFFFKKKKKKKKKAFKKKKKKKKKKKKKKKKKKKKKKKKKKKKKKKKKKKK7KKFKKKKKKKKKKKKKKKKFKKKFKKKAFFKKKKKKKKFKKKKKKKKKKKKKKFKAKKKKKKKFK<<AFFKKKKKKKK<FFFKKKKKKKKFKKAKFK< PG:Z:MarkDuplicates RG:Z:id NH:i:8 HI:i:3 nM:i:6 AS:i:282
Including chr22 after the file name pulls only the alignments for chromosome 22 since this dataset was subsetted to human chromosome 22.
samtools view hcc1395_normal_rep1.star_rg_added.sorted.dmark.bam chr22 | head -1
The fields in a SAM/BAM file are explained below.
- QNAME or query template name, which is essentially the sequencing read that was mapped onto a reference genome.
- The second column is a FLAG that provides detail on mapping. See https://broadinstitute.github.io/picard/explain-flags.html to learn about these FLAGS. For instance, the first alignment in the hcc1395_normal_rep1 SAM file has a FLAG of 99, which indicates that:
- The read is paired, indicating paired end sequencing.
- Read is mapped in proper pair.
- The mate is in the reverse strand.
- The read is the first in a pair.
- Column three contains the name of our reference genome.
- Column four provides the left most genomic coordinate where the sequencing read maps.
- The mapping quality (MAPQ) is provided in the fifth column (the higher the number, the less likely that the mapping is due to error); a value of 255 in this column means that the mapping quality is not available.
- Column six presents the CIGAR string, which informs about the match/mismatch, insertion/deletion, etc. found in the alignment.
- Column seven is the reference sequence name of the primary alignment of the NEXT read in the template. A "=" will appear if this name is the same as the current (which is expected for paired reads).
- The alignment position of the next read in the template is provided in column eight. When this is not available, the value is set to 0.
- Column nine provides the template length (TLEN), which should reflect the DNA fragment that was size selected for during library preparation.
- The tenth column is just the sequencing read (some are written as the reverse complement so be cautious. The FLAGS in column two will tell whether the sequence is reverse complemented).
- The eleventh column is the Phred quality scores of the sequencing read.
- For definition of optional fields, see https://samtools.github.io/hts-specs/.
Note that in the alignment folder, there are correspond indexed bam files with extension bai for each sample.
Post Alignment Quality Metrics
The alignment rate or percent of reads that map to the genome in bulk RNA sequencing is a good metric for determining whether the experiment is successful. The plot below shows that for this dataset, all samples achieved greater 90% unique mapping (ie. where sequencing reads map to one genomic location).
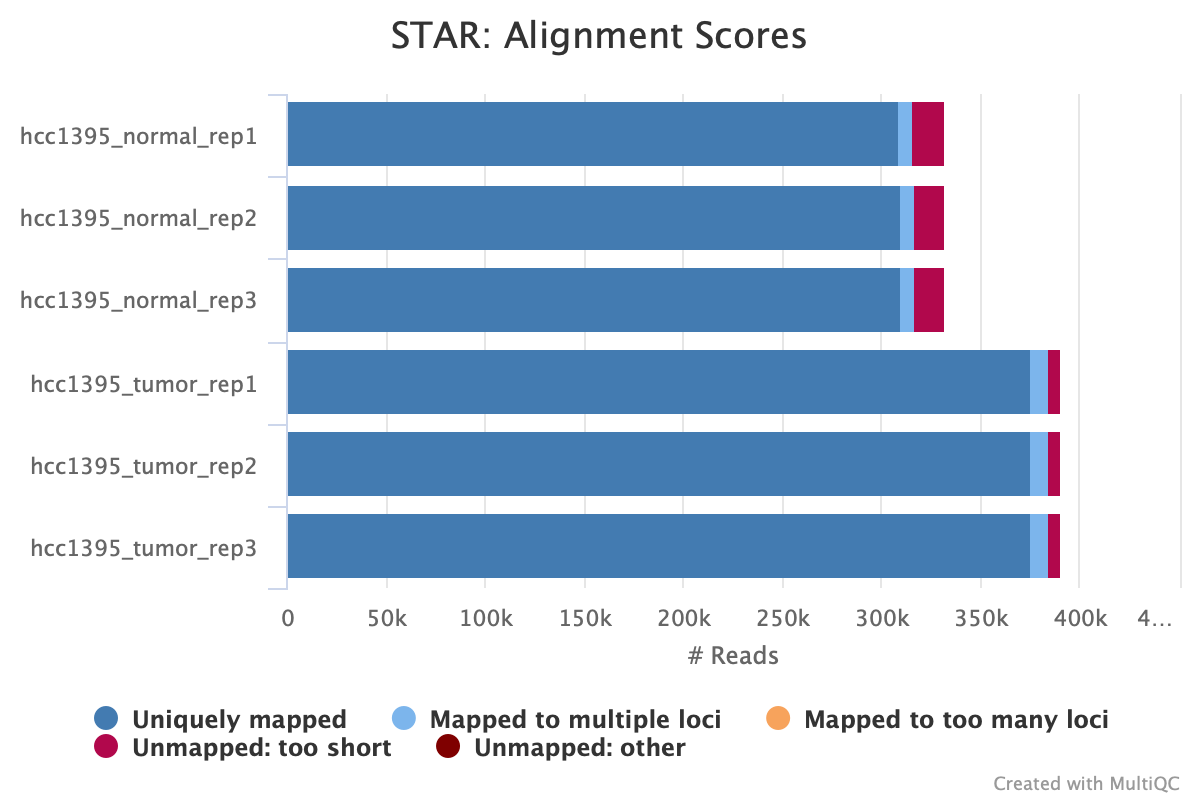
Researchers can interrogate the sample level statistics stored in the Log.final.out files in the STAR_files of the output directory.
Assuming participants are in the output directory hcc1395_renee_b4b, use the cd command to navigate to the STAR_file folder.
cd STAR_files
Use cat to look at the alignment metrics for the hcc1395_normal_rep1 sample.
cat hcc1395_normal_rep1.Log.final.out
Detailed alignmnet statistcs are shown and these include:
- Unique mapping percentage.
- Number and type of splice junctions found.
- Deletion or insertion rates.
- Number of reads that map to multiple places in the genome (multimapping) and umapped reads.
Started job on |    Feb 02 17:02:36
                             Started mapping on |   Feb 02 17:02:56
                                    Finished on |   Feb 02 17:03:51
       Mapping speed, Million of reads per hour |   21.70

                          Number of input reads |   331576
                      Average input read length |   294
                                    UNIQUE READS:
                   Uniquely mapped reads number |   311032
                        Uniquely mapped reads % |   93.80%
                          Average mapped length |   292.51
                       Number of splices: Total |   344806
            Number of splices: Annotated (sjdb) |   340737
                       Number of splices: GT/AG |   344131
                       Number of splices: GC/AG |   604
                       Number of splices: AT/AC |   63
               Number of splices: Non-canonical |   8
                      Mismatch rate per base, % |   0.51%
                         Deletion rate per base |   0.00%
                        Deletion average length |   1.27
                        Insertion rate per base |   0.00%
                       Insertion average length |   1.47
                             MULTI-MAPPING READS:
        Number of reads mapped to multiple loci |   3911
             % of reads mapped to multiple loci |   1.18%
        Number of reads mapped to too many loci |   0
             % of reads mapped to too many loci |   0.00%
                                  UNMAPPED READS:
  Number of reads unmapped: too many mismatches |   0
       % of reads unmapped: too many mismatches |   0.00%
            Number of reads unmapped: too short |   11318
                 % of reads unmapped: too short |   3.41%
                Number of reads unmapped: other |   5315
                     % of reads unmapped: other |   1.60%
                                  CHIMERIC READS:
                       Number of chimeric reads |   0
                            % of chimeric reads |   0.00%
Read Distribution
Another important QC metric after alignment is the type of genomic features are the reads mapping to. The read_distribution module in RSeQC helps determine this (https://rseqc.sourceforge.net/#read-distribution-py). For this experiment, most reads map to coding sequencing (CDS), 5'-UTR, or 3'-UTR exons. Some reads do map to other genomics regions such as introns which could be caused by:
- Genomic DNA contamination
- Biology such as retained introns
- Nascent transcript
- Unspliced or partially spliced pre-mRNA
- Incomplete annotation
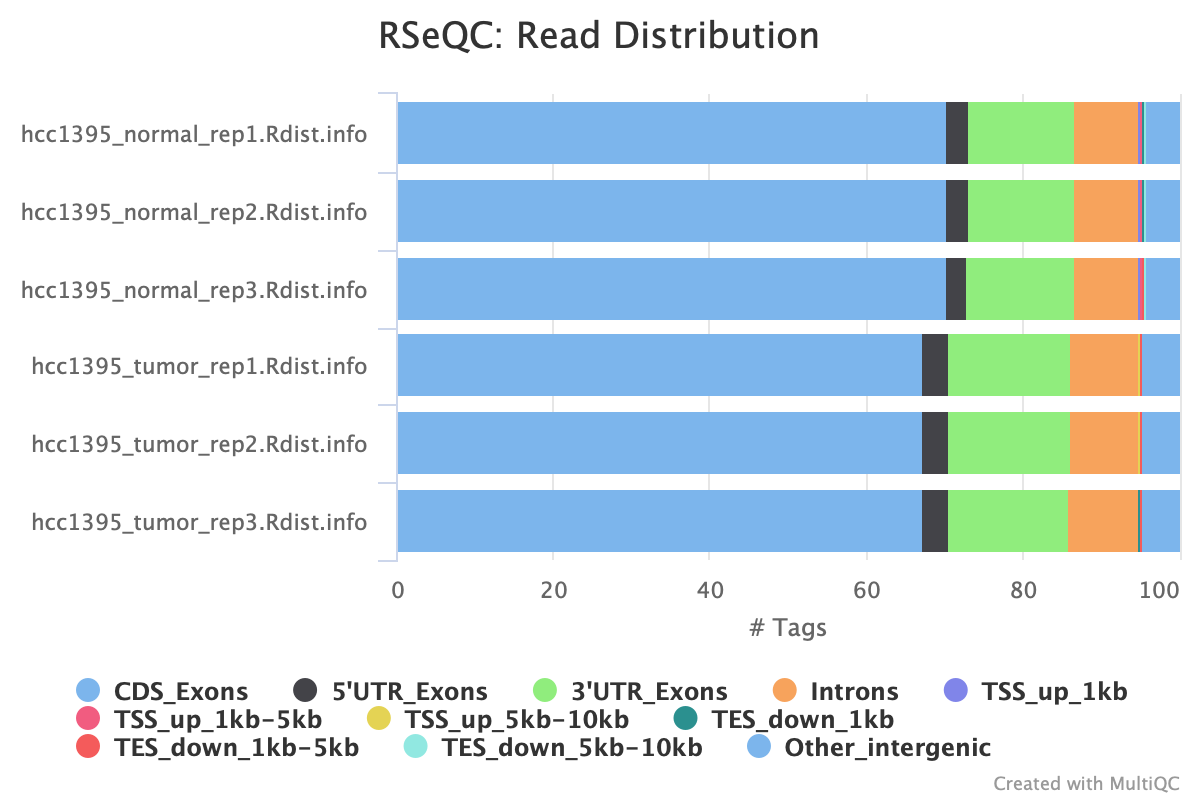
Read distribution results can be reviewed in the Rdist.info files of the RSeQC directory inside the RENEE output folder (in this class it is hcc1395_renee_b4b).
Coverage Distribution
Qualimap can be used to look at the sequencing coverage. The plot below shows the number of genomic locations with a certain amount of reads mapped to them. As expected with RNA sequencing, the majority of genomic locations have no reads map to them as the whole genome is not sequenced. Further, this dataset was subsetted to chromosome 22 and it was aligned to the entire human genome.
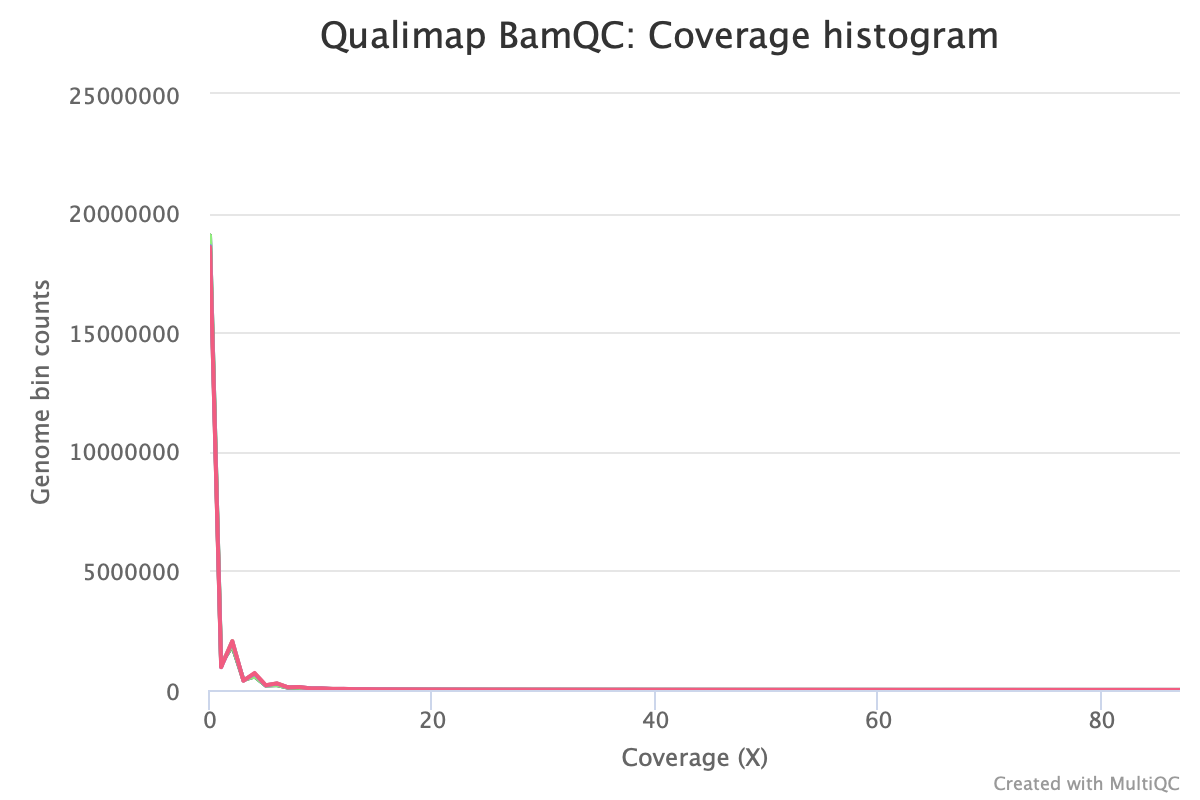
But zooming in on the plot, it is evident there are thousands of locations in the genome with over 60x coverage.

Insert Size
Qualimap calculates and plots the distribution of insert size from alignment results. Insert size distributions should be checked to ensure that the observed library fragment sizes are consistent with the size-selection criteria used during fragmentation and library preparation.

Strandedness of Experiment
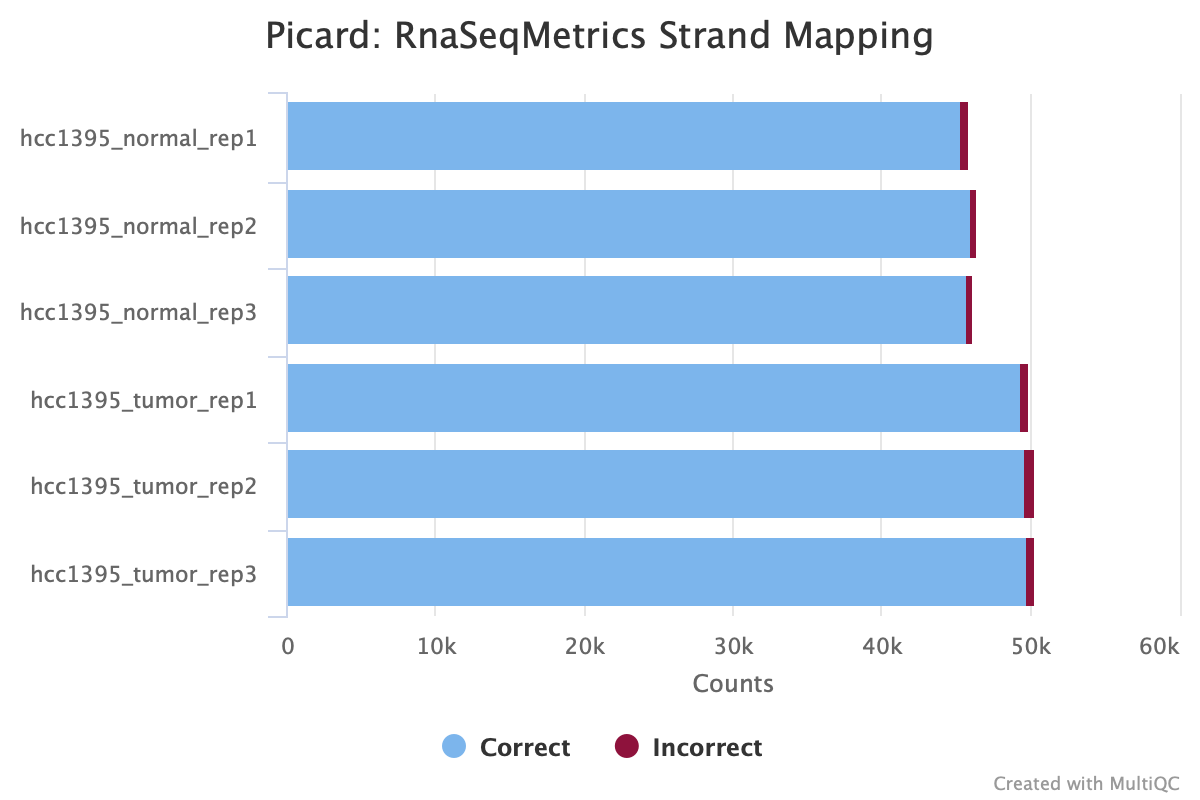
Another important post alignment QC metric is whether the sequencing reads mapped to the correct strand. This information can be obtained using the tool Picard. The plot below shows that an overwhelming majority of reads in this experiment mapped to the correct strand of the DNA double helix. This is critical as mapping to the wrong strand will lead assigning of reads to the wrong gene or transcript during the expression quantification stage.
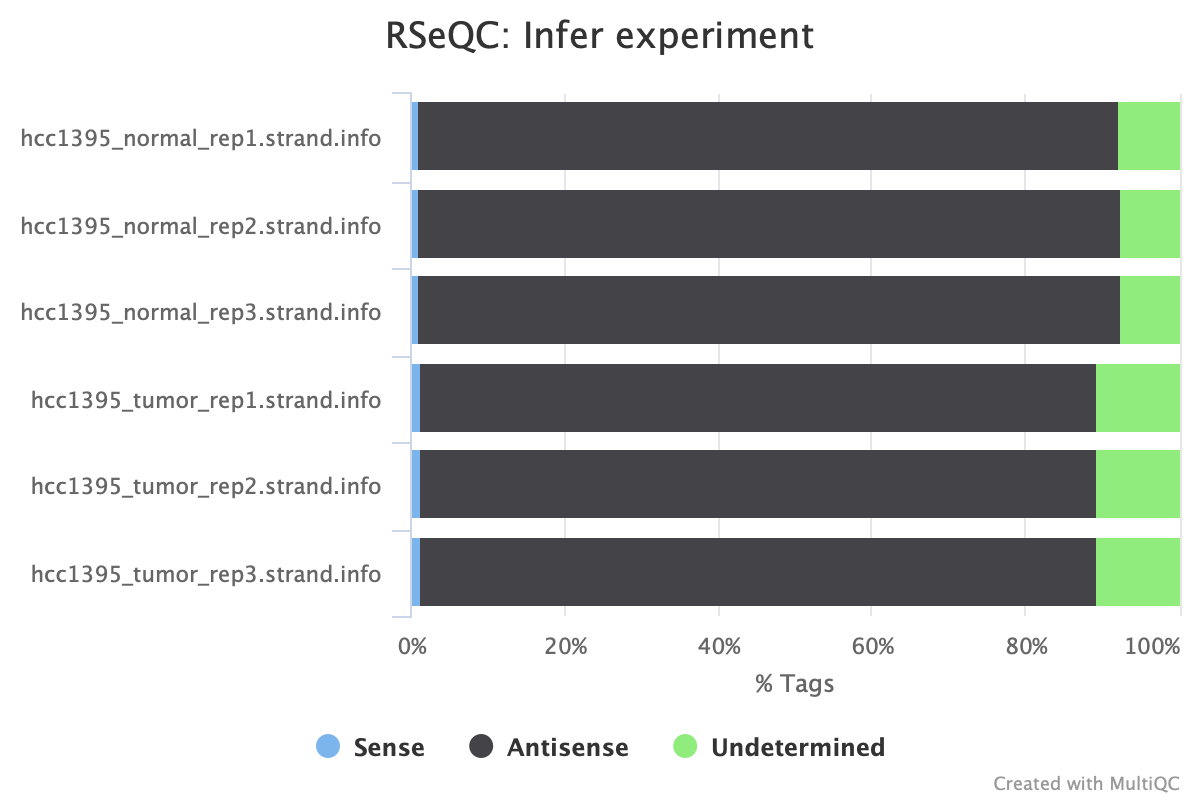
The tool rseqc can be used infer whether the bulk RNA sequencing protocol utilized a stranded protocol. It counts the number of reads or read pairs that matches the strand in which their overlapping transcript is on. The result below indicates that the experiment utilized a 1st strand protocol.
Visualizing Genomic Alingments
The Integrative Genomics Viewr is a popular tool for visualizing genomic alignment data. This enables scientists to visually inspect alignment for oddities, capture alignment results for regions of interest and/or get an idea of whether certain genes are expressed differently between conditions based on coverage. IGV can be run on local computer or launched via Biowulf HPC OnDemand.
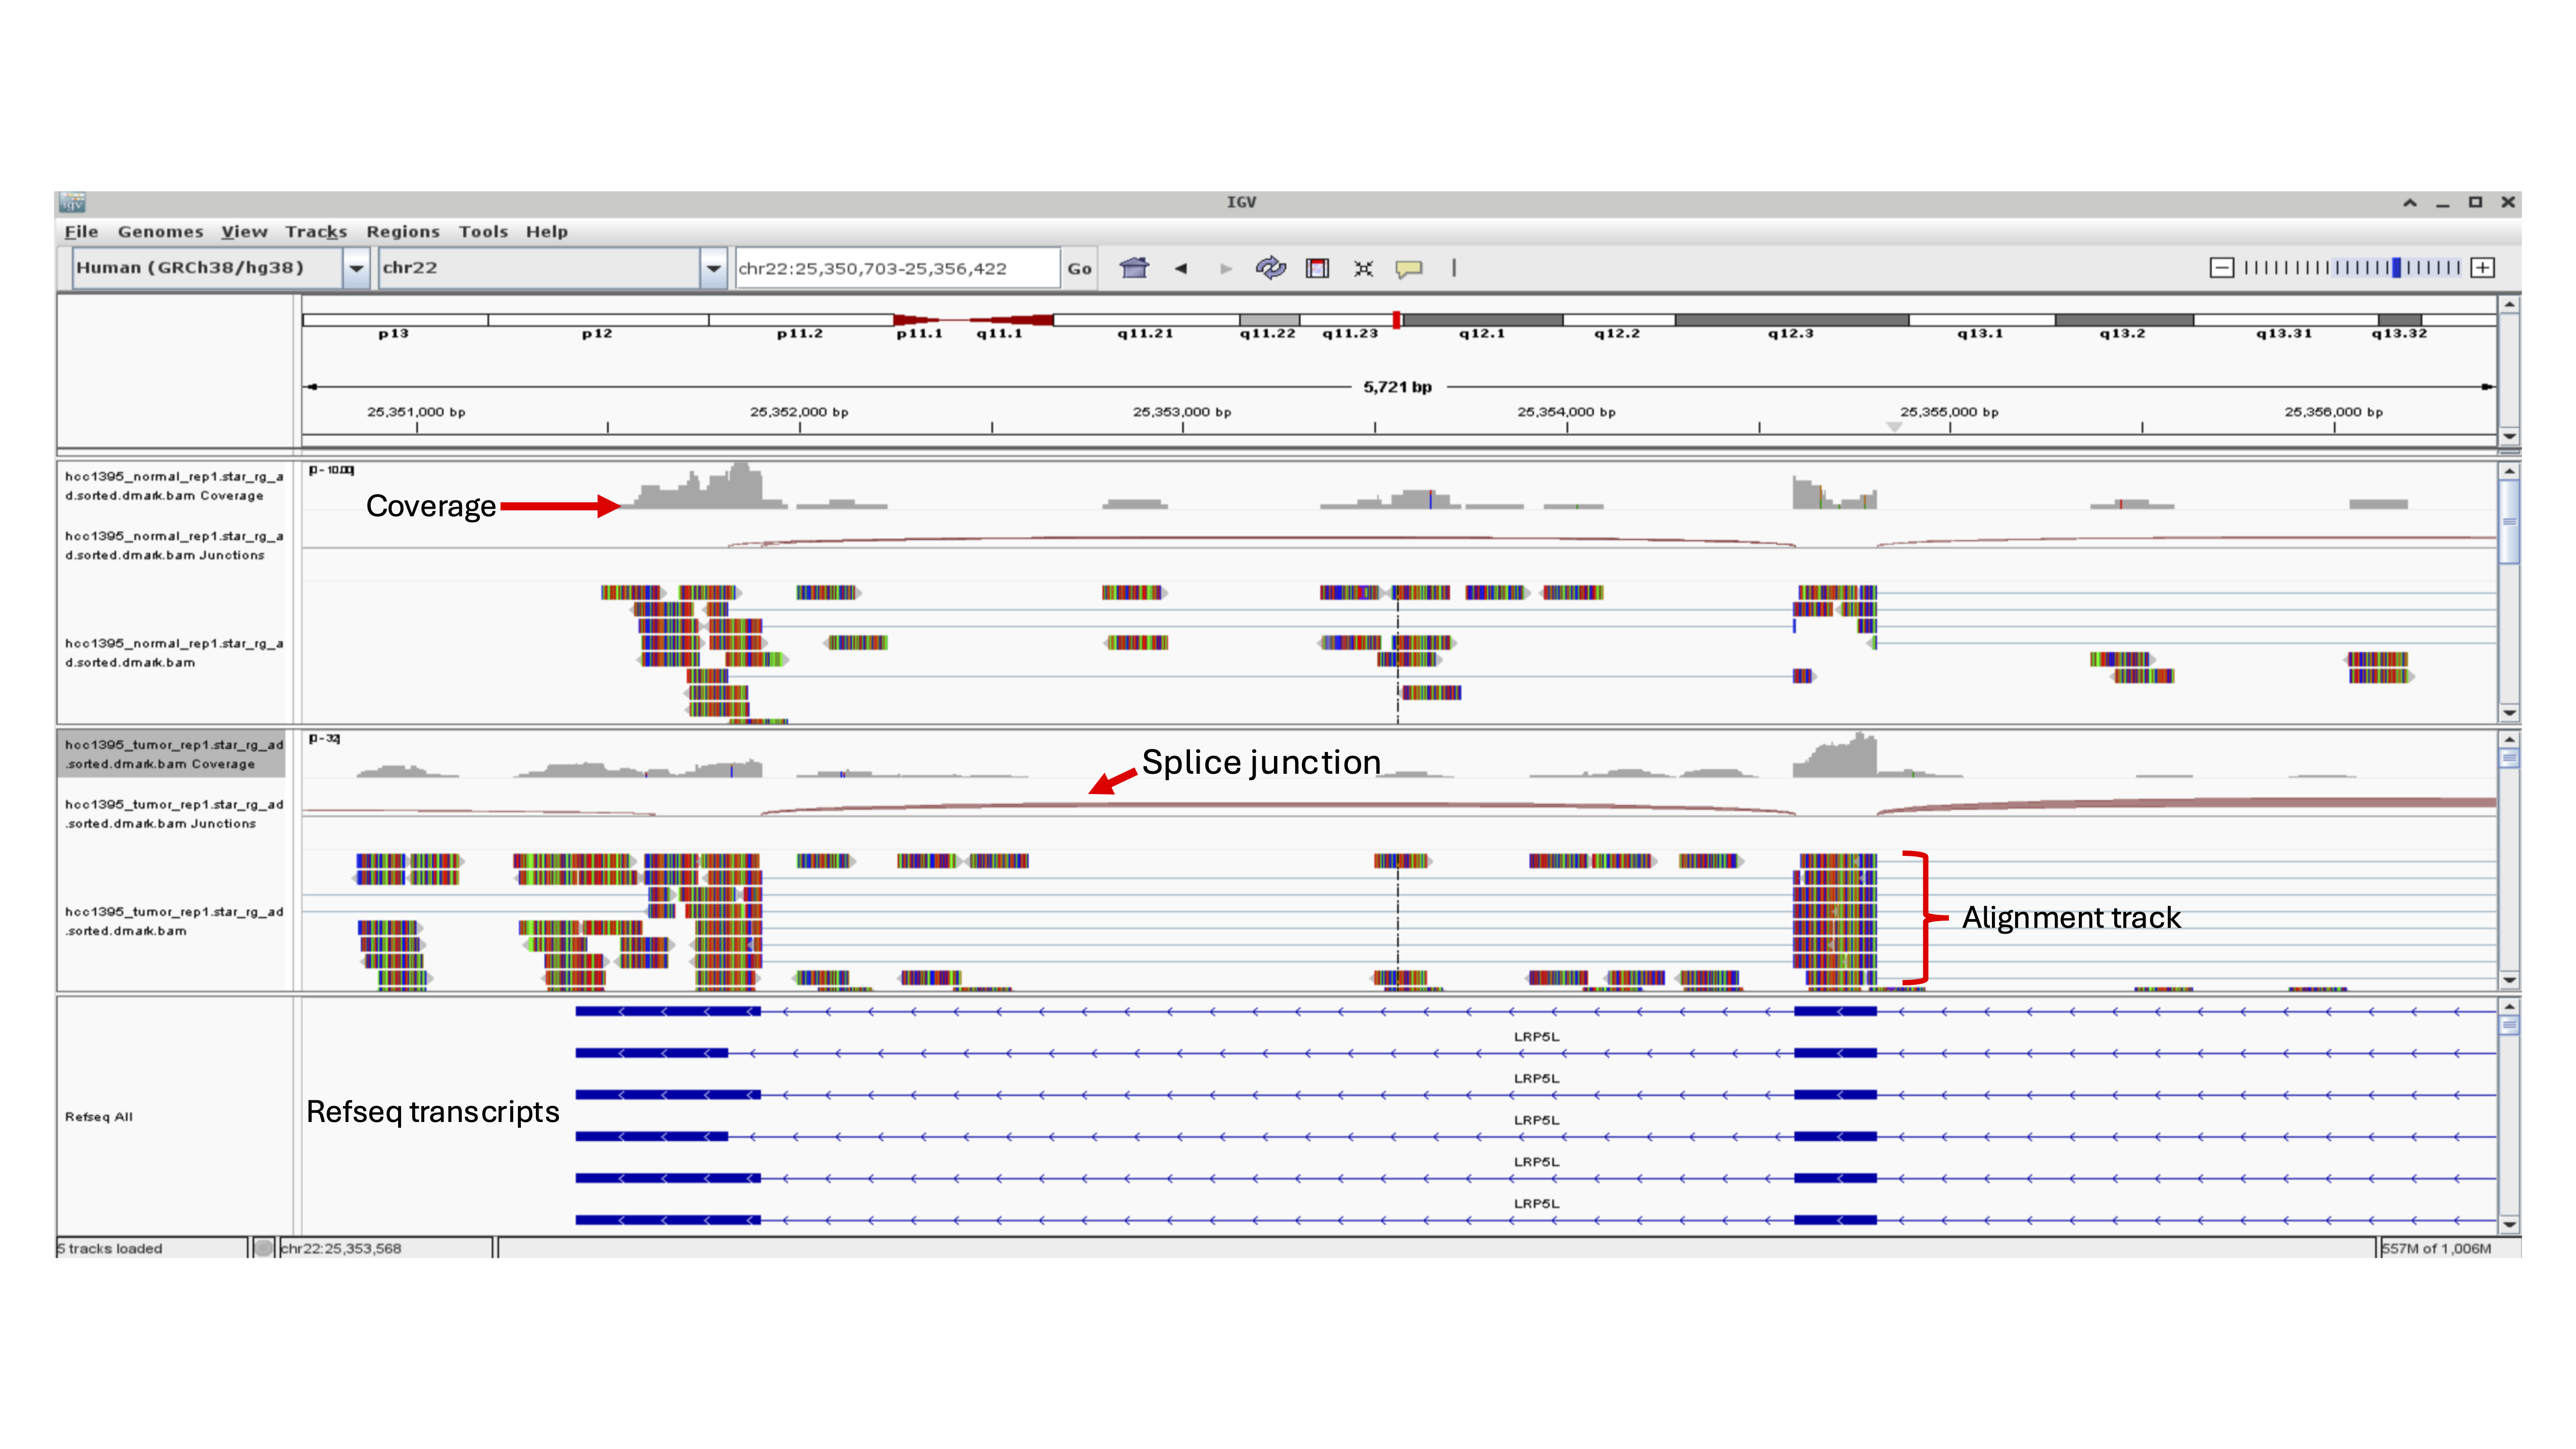
An IGV snapshot for the HCC1395 bulk RNA data is shown below. The gray bar plots represent read coverage or how many reads map to a genomic location. The pink arches designate splice junctions where reads map across multiple exons, which is unique to RNA sequencing. The track with the colored boxes contain read alignments. Finally, the track on the bottom shows the reference genome.