Introduction to Gene Ontology and Pathway Analysis
Objectives
-
Explain what functional enrichment analysis and pathway analysis are, describe how the two terms are used (often interchangeably, sometimes with a narrower distinction), and distinguish a GO term, a gene set, and a pathway from one another.
-
Describe the structure of the Gene Ontology, including its three main sub-ontologies (molecular function, cellular component, biological process).
-
Compare the four general approaches to functional enrichment and pathway analysis (over-representation analysis, functional class scoring, pathway topology, and single-sample gene set scoring) and identify which kind of question each approach is suited to answer.
-
Identify the major knowledgebases used in enrichment and pathway analysis (e.g., GO, KEGG, Reactome, DO, MSigDB, STRING) and explain what distinguishes a curated database from a meta-database or aggregator tool.
-
Explain what a background gene set is and why its choice matters for over-representation analysis, and describe the risks of testing a gene list against many databases or collections at once.
Where have we been and where are we going?
Thus far we have:
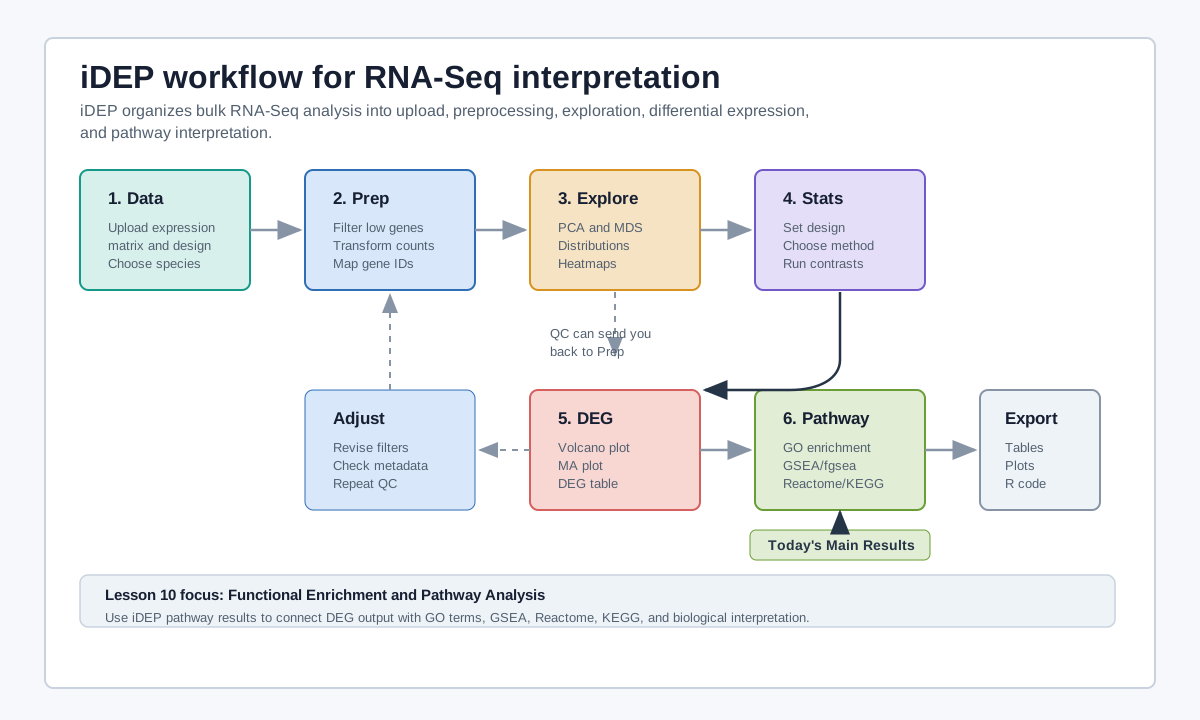
Downloaded raw RNA-Seq data (.fastq files), examined raw data quality, performed adapter and quality trimming, aligned the raw sequences to a reference genome, viewed and compared alignments, and generated a gene count matrix using CCBR's RENEE pipeline. We also performed differential expression analysis with iDEP.
You now have a potentially large list of differentially expressed genes. Now what? If you are like most biologists, you want to understand these genes within their biological context — what processes they participate in, where they act, and how they relate to one another.
To do that, we turn to gene ontology and functional enrichment or pathway analysis.
 .
.
What do we mean by gene ontology, functional enrichment, and pathway analysis?
Before going further, it's worth defining these three terms at a high level. We'll get more precise about each one as the lesson goes on, but a rough map up front will make everything else easier to place.
Gene Ontology (GO) is a specific, structured knowledgebase: a controlled vocabulary of terms describing gene product function and the annotations linking real genes to those terms. It's one particular resource among several (KEGG and Reactome are others) that the methods below can be run against.
Functional enrichment analysis is the general statistical operation of asking whether a gene list shows more overlap with some functionally defined group of genes than you'd expect by chance. It's an umbrella term. It doesn't specify which knowledgebase or which statistical method you're using, only that you're testing for over-representation or coordinated behavior of some functional grouping within your data.
Pathway analysis is often used as a near-synonym for functional enrichment analysis, and in casual usage the two terms are largely interchangeable. You will see papers describe an analysis run entirely on GO terms as "pathway analysis," even though, strictly, a GO term isn't a pathway (more on that distinction below). Where a firmer line exists, "pathway analysis" more properly refers to enrichment testing against databases of actual pathways (KEGG, Reactome) rather than more general functional groupings like GO terms.
Gene sets, GO terms, and pathways — what's the difference?
These terms get used loosely and interchangeably in the literature, so it's worth pinning them down before going further.
A gene set is simply a collection of genes grouped by some shared property, as defined by a reference knowledge base. Gene sets are "formed on the basis of shared biological or functional properties as defined by a reference knowledge base," and knowledge bases are "database collections of molecular knowledge which may include molecular interactions, regulation, molecular product(s) and even phenotype associations" (Mathur et al. 2018). A gene set doesn't imply that its members physically interact. These can be arbitrary. For example, genes on the same chromosome arm, or genes that share a GO annotation, both count as gene sets.
A GO term is a single node in the Gene Ontology's controlled vocabulary (e.g., "DNA repair" (GO:0006281)). A GO term comes with an accession number, a definition, and a position in the ontology's hierarchy. The set of all genes annotated to a GO term (plus its descendants, since annotations propagate up the hierarchy) is one particular kind of gene set known as a "GO gene set." A few other things worth knowing about GO terms: the vocabulary itself is species-agnostic, though the annotations linking real genes to terms are species-specific; both the ontology and its annotations are updated on an ongoing basis; and terms are computer-readable, which is what makes large-scale automated enrichment analysis possible in the first place.
A pathway is more specific than a generic gene set: it is not just a list of genes but includes an interaction component, a description of how the members relate to one another mechanistically (e.g., a signaling cascade, a metabolic pathway with defined reaction steps and directionality). KEGG,Reactome, WikiPathways and PANTHER pathways are pathways in this stricter sense, while a GO Biological Process term, is treated like a pathway but is less so.
Quick Definitions.
GO term → a controlled-vocabulary label.
Gene set → any group of genes sharing a property (GO terms define one kind, but there are many others — e.g., co-expression clusters, chromosomal location, curated disease genes). These may or may not represent a pathway.
Pathway → a gene set with added structural/mechanistic information about how the members interact.
Which one your analysis returns depends on the database and method you choose, which will affect how much you can say about mechanism versus simple association.
Why do gene set / pathway analysis?
Gene set and pathway analysis help answer questions like:
- Are related genes changing together?
- Which biological processes are over-represented among your DE genes?
- Are subtle, coordinated changes visible even when no individual gene is significant on its own?
- Which hypotheses are worth prioritizing for follow-up experiments?
These methods are useful because they:
- Increase the statistical power of your analysis
- Ease interpretation by reducing dimensionality — genes → processes
- Predict new roles for genes based on the company they keep
- Better integrate data from different high-throughput methods (Khatri et al. 2012) {target=_blank}
A caveat worth stating up front: pathway analysis reduces complexity, but it doesn't prove causality or pathway activation on its own. Treat a hit as a lead, not a conclusion. This is largely a hypothesis generating step, and follow-up experiments are needed to confirm any mechanistic claims.
What is gene ontology?
Many functional enrichment tools use GO terms, examining GO enrichment. What do we mean by GO?
The Gene Ontology (GO) provides a framework and set of concepts for describing the functions of gene products from all organisms. — https://www.ebi.ac.uk/ols/ontologies/go
GO is manually curated by the GO Consortium, a distributed group of biocurators, and is updated regularly.
There are two core parts to the gene ontology (check out this video for a more detailed overview):
- The ontology — the GO terms and their hierarchical relationships, forming a directed, acyclic graph (nodes = GO terms, edges = relationships like "is a" or "part of").
- The annotations — the links between real gene products and GO terms, each backed by a documented evidence code.
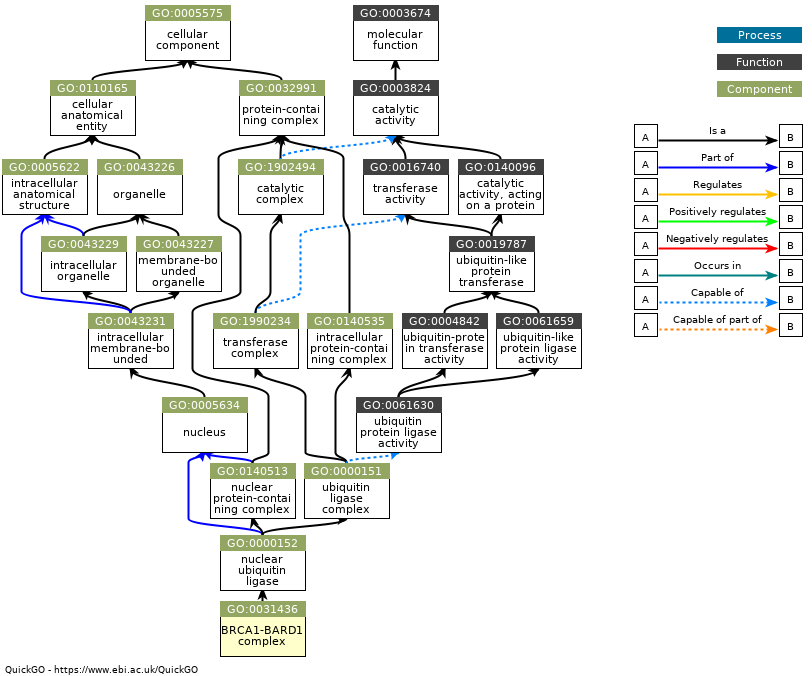 Image from https://www.ebi.ac.uk/QuickGO/GTerm?id=GO:0031436
GO integrates information about gene product function across three domains (the "three main ontologies"):
- Molecular function (MF) — the molecular activity of a gene product (e.g., kinase activity)
- Cellular component (CC) — where the gene product is active (e.g., mitochondrion)
- Biological process (BP) — the larger pathway or process the gene product's activity contributes to (e.g., transport)
Biological Process is the domain most commonly used for pathway-style enrichment analysis, since it aligns most closely with the everyday sense of "pathway."
Note
A single gene product is very often annotated to multiple GO terms across all three domains, since one protein can have several functions, live in more than one location, and participate in multiple processes.
What is GO-CAM?
GO-CAM (Causal Activity Modeling) is a newer addition to the GO knowledgebase. Where a standard annotation links one gene product to one GO term, a GO-CAM model chains multiple annotations together using formally defined relations to represent how several gene products' activities causally connect into a larger biological process, essentially building a computable "pathway diagram" out of GO terms. This narrows the historical gap between "GO is a bag of terms" and "a pathway has real structure," and it's increasingly used as an input for enrichment and network analysis tools. You can browse existing models at geneontology.org under the GO-CAM section.
GO by the numbers
As of the most recent GO knowledgebase update, the ontology contains nearly 40,000 terms (biological process, molecular function, and cellular component combined), and the annotation corpus has grown to include experimental evidence drawn from over 180,000 published papers, represented as over 1,000,000 experimentally-supported annotations, plus several million more computationally or phylogenetically inferred annotations across thousands of species. See more stats here.
What is GO Slim? Reducing semantic similarity
Pathway analysis results are often highly redundant with dozens of overlapping, near-synonymous terms coming back as "significant." Tools like DAVID's Functional Annotation Clustering, REVIGO, and GOSemSim reduce this redundancy computationally. Alternatively, you can work with GO Slim terms, which are simplified, broader subsets of the full ontology, for a high-level summary of function without wading through hundreds of overlapping child terms.
Check out geneontology.org to explore GO directly, including the ontology browser, the annotation search, GO-CAM models, and tools/guides for enrichment analysis. The GO evidence codes page is also worth a look, since not all annotations carry the same weight; for example, an experimentally validated annotation (e.g., direct assay) is stronger evidence than one inferred computationally or by sequence similarity.
Approaches to functional enrichment / pathway analysis
Functional enrichment and pathway analysis are broad, loosely defined terms, and many people use them interchangeably. Khatri et al. 2012 organized the field into three general approaches, and we'll add a fourth that has become common enough since then to warrant its own category:
- Over-Representation Analysis (ORA)
- Functional Class Scoring (FCS)
- Pathway Topology (PT)
- Single-Sample Gene Set Scoring
Over-representation analysis (ORA)
statistically evaluates the fraction of genes in a particular pathway found among the set of genes showing changes in expression — Khatri et al. 2012.
ORA asks: "Are there more genes from this pathway in my list than I'd expect by chance?"
Things to know:
- Uses tests based on the hypergeometric, Fisher's exact, chi-square, or binomial distribution to determine the probability that the overlap between your gene list and a gene set arose by chance.
- Assumes independence between genes — an assumption that rarely holds biologically, since genes in a pathway are, by definition, related.
- Requires an appropriate background gene set for comparison (see below).
- Uses an arbitrary, user-determined threshold (e.g., |fold change| > 2 and adjusted p < 0.05) to define the input list — a major source of variability between analyses.
- Doesn't require expression magnitude data, just gene identifiers — this also means it can be applied to gene lists from non-transcriptomic experiments.
- Performs best with gene lists larger than roughly 50 genes; in benchmarking comparisons, ORA methods have tended to show a higher false-positive rate than FCS methods. See Nguyen et al. 2019.
- Example tools: DAVID, Qiagen IPA, g:Profiler, ToppGene, PANTHER, Enrichr.
To better understand the statstics behind ORA, see this guide from Pathway Commons and this video from BioStatsQuid.
Background gene sets
Every ORA method needs to compare your list of "hits" against a background, which includes the universe of genes that could have been called significant. Common choices include:
- All genes in the organism of interest
- All protein-coding genes
- Only the genes measured on the platform (e.g., all probes on a microarray)
- Only the genes actually expressed in your RNA-Seq experiment — generally the recommended default for RNA-Seq
- Genes present in a specific gene set collection you're testing against
The background should represent "the universe of possible genes that could be called as significantly regulated in the experiment." Using the whole genome as background when you only measured, say, 12,000 expressed genes will systematically bias your p-values. This is one of the most common and avoidable errors in ORA.
Commercially licensed tools
QIAGEN Ingenuity Pathway Analysis (IPA) uses over-representation analysis, but its main selling point is a large, manually curated proprietary knowledge base built from the literature. Partek Flow and Qlucore are other commercial options that offer enrichment functionality, typically GSEA-based. See more about these licenses here.
Functional Class Scoring (FCS)
Includes 'gene set scoring' methods such as GSEA, which first compute DE scores for all genes measured, and subsequently compute gene set scores by aggregating the scores of contained genes. — Geistlinger et al. 2021
FCS methods are generally more sensitive than ORA, because they don't discard information by applying an arbitrary threshold, every measured gene contributes.
GSEA (Gene Set Enrichment Analysis) is the classic example:
- Does not pre-select genes; it considers the entire ranked list of gene expression changes. You need identifiers and a ranking metric (typically magnitude of change and significance) for every measured gene, not just the "significant" ones.
- Top of the ranking = upregulated + significant
- Bottom = downregulated + significant
- Middle = non-significant
- Asks whether members of a gene set cluster toward the top or bottom of that ranking, rather than being randomly scattered throughout.
- Builds a running-sum "enrichment score" as it walks down the ranked list, and evaluates significance using a permutation-based approach.
- Originally Broad Institute desktop software, but the same logic is implemented in R (
fgsea,clusterProfiler), other web tools, and commercial platforms like Qlucore. - FCS is best understood as a strategy encompassing many related methods (not just GSEA), which can further be split into self-contained methods (test whether a gene set is associated with a phenotype on its own) versus competitive methods (test whether a gene set is more associated with a phenotype than the rest of the genome is).
Check out this video overview of GSEA, and the official GSEA User Guide for a deep dive into reading enrichment plots (peak enrichment score, leading-edge subset, and the ranking-metric track). You may also be interested in this GSEA with R tutorial from a past BTEP Coding Club.
MSigDB and its relationship to GSEA
The Molecular Signatures Database (MSigDB), maintained by the Broad Institute, is the standard gene set collection paired with GSEA, though its gene sets are widely reused by other tools too.
- Covers both human and mouse.
- The human collection now contains roughly 35,000+ gene sets (this number grows with each release, so treat it as an order of magnitude rather than a fixed count).
-
Organized into major thematic collections, including:
- H (Hallmark) — a curated, low-redundancy summary of well-defined biological states; a strong default choice for many studies.
- C2 — curated gene sets from publications and pathway databases (including KEGG and Reactome).
- C5 — the Gene Ontology collection.
- C7 — immunologic signatures, useful for immunology-focused studies.
- C9 — a newer collection (added in early 2026) worth checking if your project touches its focus area; consult the MSigDB collections page for the current, versioned list, since collections continue to be added.
You can also build and submit your own custom gene sets for use with GSEA.
Pathway Topology (PT)
ORA and FCS both discard structural information. Even when the gene set in question represents a "real" pathway, these methods ignore how the genes interact, their position in the pathway, and their type (e.g., activator vs. inhibitor). Pathway Topology methods try to fix this by modeling the pathway's actual network structure.
Example — Impact analysis (iPathwayGuide):
constructs a mathematical model that captures the entire topology of the pathway and uses it to calculate a perturbation for each gene. Then, these gene perturbations are combined into a total perturbation for the entire pathway and a p-value is calculated by comparing the observed value with what is expected by chance. - https://advaitabio.com/ipathwayguide/more-accurate-pathway-rankings-using-impact-analysis-instead-of-enrichment/
Other tools: Pathway-Express, SPIA, NetGSA, TPEA. See Nguyen et al. 2019 for a review.
PT methods tend to be more mechanistically informative, but they "require experimental evidence for pathway structures and gene–gene interactions, which is largely unavailable for many organisms." This is also, in general, the most methodologically variable and least standardized of the three approaches. You should approach results from any single PT tool as one line of evidence, not a final answer.
Single-Sample Gene Set Scoring
ORA, FCS, and PT all answer a version of the same question: is this pathway different between my groups? Single-sample scoring methods ask a different question entirely: how active is this pathway in this one sample?
Rather than testing for a difference between conditions, these methods transform your expression matrix into a new matrix of scores (one score per sample, per gene set) describing where each individual sample falls on that pathway's activity spectrum, independent of any comparison group. This reframes "pathway activity" as a derived feature of each sample, much like a gene's expression value is a feature of that sample, except now the feature describes a whole pathway rather than one gene.
That reframing is what makes these methods useful in situations the other three categories aren't built for:
- Comparing pathway activity across more than two groups, or along a continuous variable (dose, time, disease severity), without needing a single pairwise contrast.
- Feeding pathway-level scores into downstream analyses — clustering samples, survival analysis, or machine learning models — the same way you would use gene-level expression values.
- Working with single-cell data, where "the sample" is a cell and you want a per-cell pathway activity score for visualization or clustering, rather than one enrichment statistic for an entire dataset.
Common methods include:
- GSVA (Gene Set Variation Analysis) — estimates each gene's relative expression rank within a sample, then aggregates within a gene set using a Kolmogorov–Smirnov-like running-sum statistic (conceptually related to GSEA, but computed per sample rather than across a ranked group comparison).
- ssGSEA (single-sample GSEA) — a direct per-sample adaptation of the original GSEA algorithm; computes an enrichment score for each sample/gene-set pair based on the rank of gene set members within that one sample's expression profile.
- PLAGE (Pathway Level Analysis of Gene Expression) — uses singular value decomposition on standardized expression data to derive a single representative "eigengene" score per pathway per sample.
- Combined z-score / M-scores — simpler, faster approaches that aggregate standardized (z-scored) expression values across a gene set's members.
- Newer, faster methods (e.g., singscore, UCell, AUCell, PLAID) have been developed largely to handle the scale of single-cell datasets, where GSVA and ssGSEA can become computationally impractical.
For a deeper dive, see the following:
-
Toro-Domínguez D, Wang C, Ellson-Lancho I, et al. Benchmarking single-sample gene set scoring methods for application in precision medicine. Briefings in Bioinformatics. 2025;26(6):bbaf684. https://doi.org/10.1093/bib/bbaf684 (freely available via PMC)
-
GSVA package vignette from Bioconductor - https://bioconductor.org/packages/release/bioc/vignettes/GSVA/inst/doc/GSVA.html
- Dave Tang's Blog on GSVA
What tools are available?
This is neither a comprehensive list of tools nor an endorsement of certain tools, but rather a list of semi-popular tools with different approaches.
Note
There are a ton of tools out there. Be aware of the background methods used and the quality of results returned. Also, check to see when the tool was last updated.
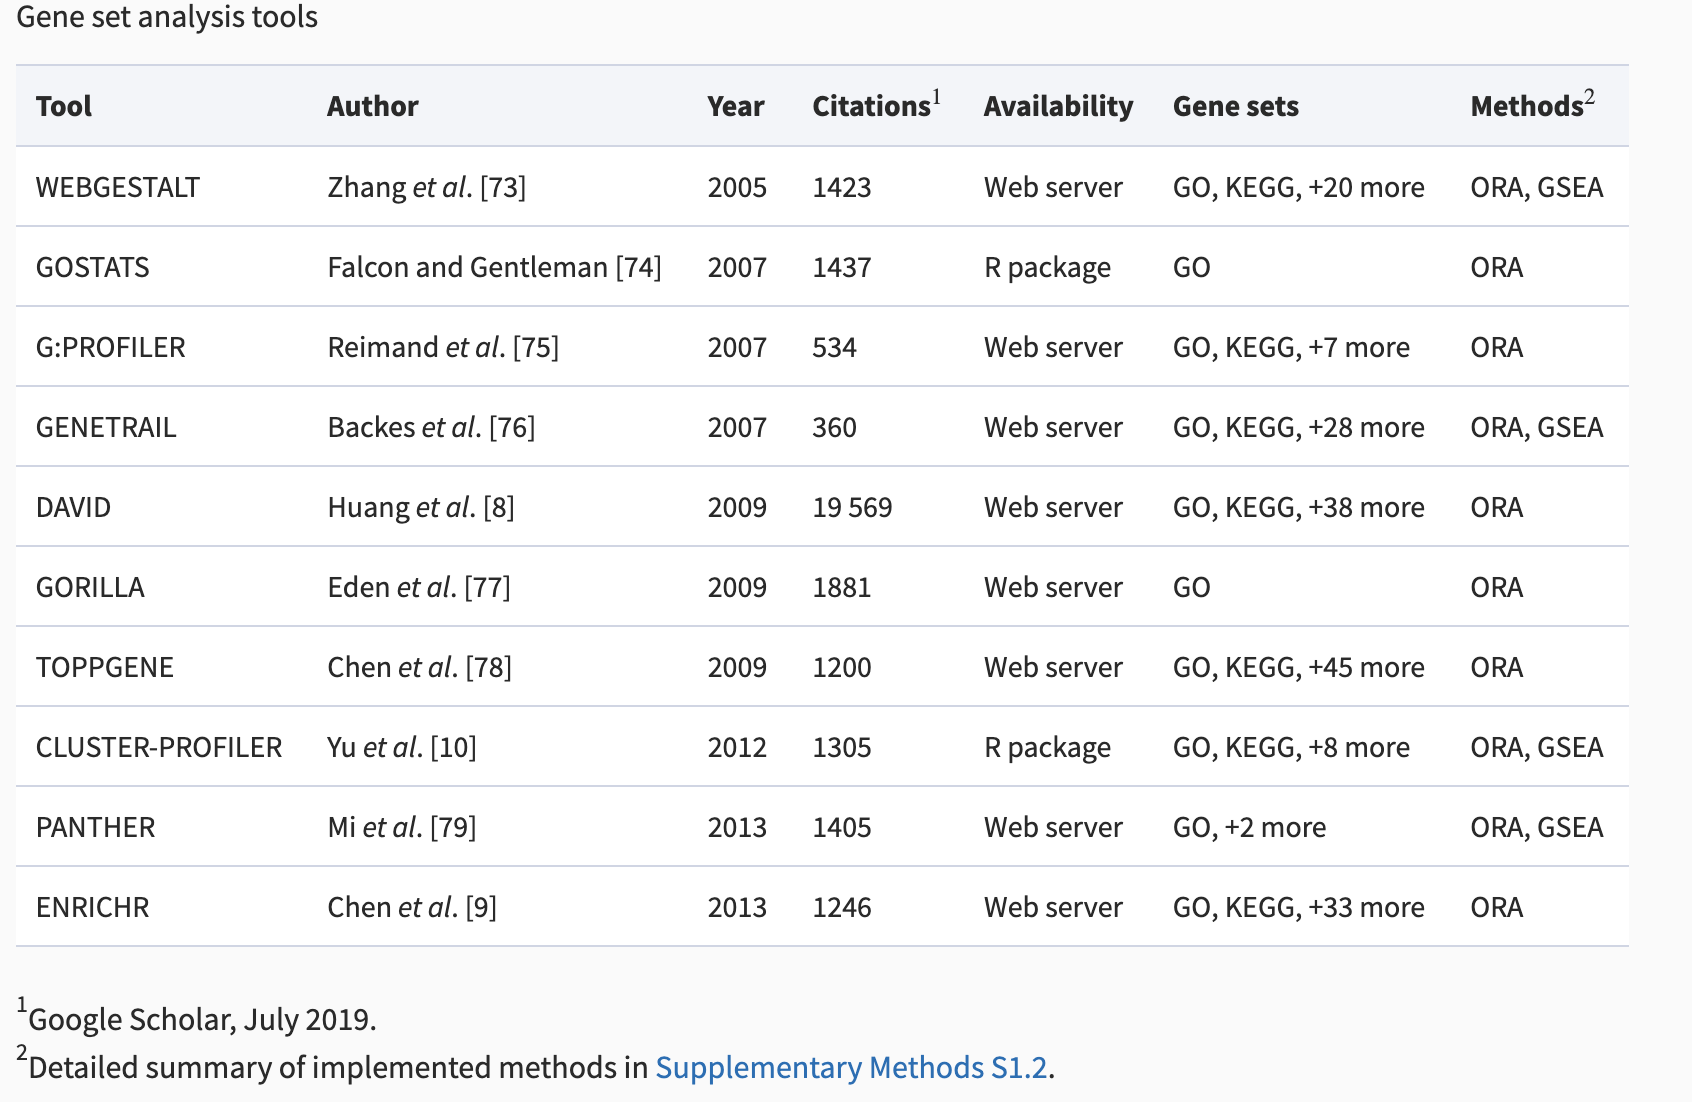
Table from Geistlinger et al. 2021
Other and related tools
- Gene Set Enrichment Analysis (GSEA)
- EnrichmentMap
- REVIGO (reducing and visualizing gene ontology)
- Pathview
- iPathwayGuide (proprietary)
- Qiagen IPA (proprietary, CCR license)
- Qlucore (proprietary, CCR license)
- GeneMANIA
- CellNetAnalyzer
- PARADIGM
BTEP Tutorials on Specific Tools
- GSEA (via ClusterProfiler) - https://bioinformatics.ccr.cancer.gov/docs/btep-coding-club/CC2025/GSEA/GSEA/
- ClusterProfiler - https://bioinformatics.ccr.cancer.gov/docs/btep-coding-club/CC2023/FunctionalEnrich_clusterProfiler/
- DAVID - https://bioinformatics.ccr.cancer.gov/docs/btep-coding-club/CC2024/DAVID/DAVID/
Databases used by enrichment and pathway tools
There are many databases devoted to relating genes and gene products to pathways, processes, and other phenomenon. Again, the following is not meant to be a comprehensive list.
Gene Ontology (GO)
Covered in detail above — the controlled vocabulary and annotation source behind most "GO enrichment" results.
Kyoto Encyclopedia of Genes and Genomes (KEGG)
- Curated database of biological pathways and molecular interaction networks.
- Well-known for its detailed, manually drawn pathway maps: metabolic pathways, disease pathways, drug-target interactions, and more.
- Emphasizes system-level integration of genomic and chemical information.
- Free for academic use through the KEGG API/FTP is limited; the full, most current dataset requires a subscription license (this has been the case for some time and is worth double-checking against KEGG's current terms before building a pipeline around it).
Reactome
The Reactome Knowledgebase systematically links human proteins to their molecular functions, providing a resource that functions both as an archive of biological processes and as a tool for discovering novel functional relationships in data such as gene expression studies or catalogs of somatic mutations in tumor cells. — Jassal et al. 2019
- Curated database covering metabolism, signaling, and other processes; human-specific (though includes some inferred orthologous data for other species).
- Includes disease super-pathways.
- Comes with several built-in analysis tools directly on reactome.org (pathway browser, over-representation and expression analysis tools, and, as of recently, an AI-assisted chat interface for navigating the database).
Pathway Commons
A meta-database that aggregates and standardizes pathway data from many other pathway databases into one queryable format.
PANTHER
The PANTHER (Protein ANalysis THrough Evolutionary Relationships) Classification System was designed to classify proteins (and their genes) in order to facilitate high-throughput analysis. The core of PANTHER is a comprehensive, annotated "library" of gene family phylogenetic trees. — pantherdb.org
Especially useful when evolutionary relationships between gene families matter to your question. PANTHER also powers the enrichment tool built directly into the GO Consortium's own website.
STRING
A database of known and predicted protein-protein interactions, combining evidence from experiments, curated pathway databases, co-expression, and text-mining into a single confidence-scored network. STRING is one of the most widely used resources for visualizing how a gene list's products physically or functionally connect. This database is often useful for Pathway Topology methods.
Enrichr
Not a single curated knowledgebase but a meta-tool: a fast, web-based ORA interface that lets you test a gene list against 200+ separate gene set libraries in one submission — GO, KEGG, ChEA (transcription factor targets), disease and drug-perturbation signatures, cell-type markers, and more. Its breadth is exactly what makes it popular for quick exploration, and exactly why it deserves the caution described in the callout below: testing against that many libraries at once multiplies your chances of a "significant" hit by chance alone.
WikiPathways
A community-curated, wiki-style meta-database of pathways. WikiPathways is a good source for newer or less-established pathways that haven't yet made it into more conservative curated databases like KEGG or Reactome.
NDEx
The NDEx Project provides an open-source framework where scientists and organizations can store, share, manipulate, and publish biological network knowledge. — ndexbio.org
HumanCyc (See BioCyc)
HumanCyc provides an encyclopedic reference on human metabolic pathways, the human genome, and human metabolites. — humancyc.org
Free BioCyc accounts allow browsing, but bulk data access, APIs, and the desktop Pathway Tools software require a paid BioCyc subscription (pricing starts in the low thousands of dollars per year) — check current terms before designing a pipeline around it.
Disease Ontology (DO)
A structured, controlled vocabulary for human disease terms, designed to standardize disease naming and support integration across genomic and clinical datasets. DO is used by disease-enrichment tools (e.g., the DOSE R package) the same way GO is used for functional enrichment. It lets you ask "are my differentially expressed genes enriched for association with any particular disease?" It is often paired with gene-disease association resources.
DisGeNET
A knowledgebase of gene–disease associations, aggregating curated repositories, GWAS catalogs, animal model data, and literature-derived associations. Worth flagging: DisGeNET has moved to a tiered access model — a free academic/non-commercial plan is available, but higher tiers (with text-mined associations, drug/chemical annotations, and full API access) require a paid license. Confirm your access level before building a pipeline that depends on it.
Check Versions for tools and databases
- Not all databases survive. Check when a database was last updated before relying on it. Pathguide, a once-popular searchable index of pathway databases, is a good illustration of the point it exists to make: it hasn't been substantially updated since 2017, so treat any list it returns as a starting point for further checking, not a current recommendation.
- Not all tools stay maintained. An unmaintained tool is quietly running on stale annotation versions, even if its web interface still loads. When in doubt, check the tool's own changelog or publication history.
The Multiple Testing Trap
Modern tools make it easy to test one gene list against many collections at once (GO, KEGG, Reactome, MSigDB collections, disease/drug libraries), sometimes in a single click. The statistical catch is multiplicity: as the number of tests increases, the chance of at least one false-positive finding also increases.
Most enrichment workflows report adjusted p-values (often BH/FDR) for the set of hypotheses tested within that run or collection. If you run many collections and then focus on only one favorable result, your overall error control is weaker than those per-collection adjusted values may suggest.
A second risk is selective reporting: trying many databases and highlighting only the one that supports your hypothesis (even unintentionally). More attempts create more opportunities for a spurious but convenient hit.
Good practice helps: - Pre-specify which databases/collections you will test (confirmatory set) before seeing results. - Report all tested collections, not only the ones with significant hits. - Treat broad multi-database scans as exploratory, and label them clearly as such. - Give more weight to signals that replicate across independent resources and analysis methods.
Importance of Gene IDs
To run any of these tools, you need a list of annotated genes, and gene ID systems don't all agree with each other. GO annotations, for instance, are commonly cross-referenced to Entrez, Ensembl, and official HGNC gene symbols, but converting cleanly between systems is not always one-to-one.
A few practical notes:
- Genome builds matter. Coordinates and even gene models can differ between reference builds, which affects ID mapping. See this tutorial from the Harvard Chan Bioinformatics Core for more detail.
- Be careful with Excel. Spreadsheet software has a well-documented history of silently "autocorrecting" gene symbols into dates (e.g., turning "SEPT1" into a date). This has caused real errors and even paper corrections in the literature. Avoid opening raw gene ID lists in Excel without disabling autoformatting, or better, avoid Excel for this step entirely.
- Double-check gene identity, not just the ID string. Confusing nomenclature and symbol reuse across species or gene families has led to retractions. Make sure the gene you're discussing in a paper is actually the gene you think it is.
Tools to help with ID conversion:
- g:Convert
- Ensembl BioMart.
- AnnotationHub (Bioconductor)
- DAVID Gene ID Conversion
Other considerations
- Describe your method(s) clearly in any resulting publication, including exact parameters, software versions, and the release date/version of any database used (e.g., "GO release 2026-XX-XX," "MSigDB v2026.1").
- For ORA, choose an appropriate, defensible background gene set and state it explicitly.
- Correct p-values for multiple comparisons whenever testing more than one gene set, to control the false discovery rate, and remember this correction generally does not extend across separate databases (see the callout above).
- Many classic enrichment methods were built specifically for transcriptomic data. Other -omics types (proteomics, metabolomics, single-cell RNA-seq, GWAS) have different statistical properties, and using a transcriptomics-native tool on them without adjustment can produce misleading results. See Zhao and Rhee 2023 for a review of methods suited to specific -omics types.
- Emerging area to watch: LLM-assisted interpretation of enrichment results (several databases, including Reactome, have begun adding AI chat interfaces, and DisGeNET now offers a natural-language query assistant). These can speed up literature triage but don't replace checking the underlying statistics and evidence codes yourself.
Functional enrichment and pathway analysis in iDEP
In the next lesson, you will explore functional enrichment and pathway analysis with iDEP, a web-based tool that wraps many of the R packages mentioned above behind a point-and-click interface. As you work through it, it's worth knowing which of our four categories — ORA, FCS, PT, or single-sample scoring — each iDEP option falls into, since that tells you what kind of input it expects and how to interpret its output.
| iDEP tool | Category |
|---|---|
| Functional Enrichment tab | ORA |
| GAGE | FCS (fold-change/t-test based) |
| GSEA (fgsea) | FCS (rank-based) |
| PGSEA | FCS (parametric) |
| ReactomePA | FCS (Reactome-scoped) |
| GSVA / ssGSEA / PLAGE | Single-Sample Gene Set Scoring |
| Pathview | Visualization (not a statistical method) |
References / Resources
- Mathur et al., "Gene set analysis methods: a systematic comparison," BioData Mining, 2018 — https://biodatamining.biomedcentral.com/articles/10.1186/s13040-018-0166-8
- Gene Ontology definition, EBI Ontology Lookup Service — https://www.ebi.ac.uk/ols/ontologies/go
- GO overview video — https://www.youtube.com/watch?v=6Am2VMbyTm4
- ClusterProfiler tutorial
- Functional enrichment and comparison with R
- ClusterProfiler, pathview, and good introductory information
- Article on the impact of the evolving GO
- Ten Years of Pathway Analysis: Current Approaches and Outstanding Challenges, PLOS Computational Biology, 2012
- Nguyen et al., "A comprehensive survey of tools and software for active subnetwork identification," reviewed in the context of pathway topology methods and ORA benchmarking, Genome Biology, 2019 — https://genomebiology.biomedcentral.com/articles/10.1186/s13059-019-1790-4
- Pathway Commons guide to Fisher's exact test — https://www.pathwaycommons.org/guide/primers/statistics/fishers_exact_test/
- BioStatsQuid, video overview of Fisher's exact test and ORA statistics — https://www.youtube.com/watch?v=H1cUs6pql9s&list=PLRGSLMDpRxCrTybN8g8GjNk39lmzJ2UTF&index=2
- Timmons, J.A., Szkop, K.J. & Gallagher, I.J. Multiple sources of bias confound functional enrichment analysis of global -omics data. Genome Biol 16, 186 (2015). https://doi.org/10.1186/s13059-015-0761-7
- Reimand, J., Isserlin, R., Voisin, V. et al. Pathway enrichment analysis and visualization of omics data using g:Profiler, GSEA, Cytoscape and EnrichmentMap. Nat Protoc 14, 482–517 (2019). https://doi.org/10.1038/s41596-018-0103-9
- GSEA overview video — https://www.youtube.com/watch?v=egO7Lt92gDY
- Official GSEA User Guide — https://docs.gsea-msigdb.org/#GSEA/GSEA_User_Guide/
- Toward a gold standard for benchmarking gene set enrichment analysis, Briefings in Bioinformatics, 2021 (also the source of the functional enrichment tools comparison table, sometimes cited by its 2020 preprint/online-first date)
- Zhao and Rhee, "Interpreting omics data with pathway enrichment analysis," Trends in Genetics, 2023 — https://www.sciencedirect.com/science/article/pii/S0168952523000185
- Introductory lectures on functional enrichment and R from DIY Transcriptomics
- The Gene Ontology Consortium. The Gene Ontology knowledgebase in 2026. Nucleic Acids Res. 2025 Dec 18;gkaf1292. DOI: https://doi.org/10.1093/nar/gkaf1292
- Brad T Sherman, Ganesh Panzade, Thoai Dotrang, Ming Hao, Lei Xu, Xuan Li, Michael W Baseler, H Clifford Lane, Tomozumi Imamichi, Weizhong Chang, DAVID: a web server for functional annotation and functional enrichment analysis of gene lists (2025 update), Nucleic Acids Research, Volume 54, Issue W1, 7 July 2026, Pages W367–W373, https://doi.org/10.1093/nar/gkag470
- Damian Szklarczyk, Katerina Nastou, Mikaela Koutrouli, Rebecca Kirsch, Farrokh Mehryary, Radja Hachilif, Dewei Hu, Matteo E Peluso, Qingyao Huang, Tao Fang, Nadezhda T Doncheva, Sampo Pyysalo, Peer Bork, Lars J Jensen, Christian von Mering, The STRING database in 2025: protein networks with directionality of regulation, Nucleic Acids Research, Volume 53, Issue D1, 6 January 2025, Pages D730–D737, https://doi.org/10.1093/nar/gkae1113
- Toro-Domínguez et al., Benchmarking single-sample gene set scoring methods for application in precision medicine, Briefings in Bioinformatics, 2025 — https://doi.org/10.1093/bib/bbaf684
- GSVA package vignette, Bioconductor — https://bioconductor.org/packages/release/bioc/vignettes/GSVA/inst/doc/GSVA.html
- Dave Tang's Blog on GSVA
- BTEP: Pathways and gene sets — what is functional enrichment analysis?