UCSC Xena: A Tool to Interactively View Cancer Data
When: Sep. 27th, 2017 10:00 am - 3:00 pm
To Know
Where:
Bldg 10 FAES room 4 (B1C205)
Organizer:
BTEP
About this Class
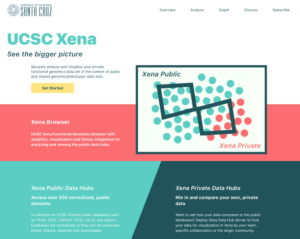 UCSC Xena (http://xena.ucsc.edu) is a web-based, visual exploration tool for all modes of multi-omic data and associated annotations. Xena has several seminal cancer datasets pre-loaded and ready for visualization including TCGA, ICGC, GTEx and more. Our public datasets include somatic SNPs, INDELs, large structural variants, CNV, gene-, transcript-, exon- protein-, miRNA-expression, DNA methylation, phenotypes, and clinical data. Xena dynamically generates KM plots as well as visualizes data in a spreadsheet-like view, box plot, bar graph or scatter plot. Using our data hubs and browser, you can easily view both your annotations on top of our datasets, like TCGA, as well as your own genomics data. We fully support human cells, samples, cell lines, organoids, xenografts, etc, and also have basic support for mouse and other species.
Session 1: 10 am - 12 pm
UCSC Xena (http://xena.ucsc.edu) is a web-based, visual exploration tool for all modes of multi-omic data and associated annotations. Xena has several seminal cancer datasets pre-loaded and ready for visualization including TCGA, ICGC, GTEx and more. Our public datasets include somatic SNPs, INDELs, large structural variants, CNV, gene-, transcript-, exon- protein-, miRNA-expression, DNA methylation, phenotypes, and clinical data. Xena dynamically generates KM plots as well as visualizes data in a spreadsheet-like view, box plot, bar graph or scatter plot. Using our data hubs and browser, you can easily view both your annotations on top of our datasets, like TCGA, as well as your own genomics data. We fully support human cells, samples, cell lines, organoids, xenografts, etc, and also have basic support for mouse and other species.
Session 1: 10 am - 12 pm
- Data overview: TCGA, ICGC, GTEx and more
- Navigating our visualizations
- Running a KM analysis
- In-depth coverage of Xena's features
- Comprehensive filtering of samples
- Viewing your own data