A Beginner's Guide to Troubleshooting R Code
Learning Objectives
In this coding club, we will
- Discuss commonly observed errors.
- How to approach and debug R code.
- How to find help.
Debugging is the process of identifying and fixing errors or potential errors in your code. There are many functions and packages that are available for debugging R code. For example, see this chapter from Advanced R.
Keep in mind that not all problems with your code are going to result in an error message. The code may run fine, but the results are unexpected or the code runs seemingly without end.
This session of the BTEP Coding Club will focus on ways to approach (and avoid) errors from a beginner perspective. We will NOT cover various debugging tools.
Approaching Common Errors in R.
Identifying errors in your script.
First, it is important to recognize that RStudio is extremely helpful in identifying mistakes in our code in the IDE editor pane via code diagnostics in the margin. We can skim our code easily for potential typos and other mistakes.

Common Errors
It is impossible to comprehensively review all error messages, but some error / warning messages are more common than others and worth a review.
Note
Most errors center around a common theme: R is looking for something and can't find it.
Syntax errors
Errors related to typos and missing punctuation (quotes, parentheses, braces, etc.).
Unmatched parentheses, curly braces, square brackets or quotes.
# unmatched parantheses
res <- sum(1,2
Error: <text>:3:0: unexpected end of input
1: # unmatched parantheses
2: res <- sum(1,2
  ^
- The R console will prompt you for a completed phrase with a
+. The easiest way to see or fix these is by opening your R script in an editor and checking for error flags.
Typos in function, variable, data set, object, package name, etc.
#misspelled object
#mtcars
mean(mcars$wt)
Error in mean(mcars$wt): object 'mcars' not found
object not founderrors can be fixed by checking to make sure the object name was correctly typed and/or that the object exists. You can see a list of objects that you created usingls()or by checking your global environment.
#misspelled function
# looking for mean()
men(mtcars$wt)
Error in men(mtcars$wt): could not find function "men"
could not find functionerrors typically result from a typo in the function name or because the package from which the function is supplied has not been installed and/or loaded.
Note
install.packages() requires the name of the package in single or double quotes, while library() to load an installed package, does not.
Errors in function arguments
These include missing arguments, arguments supplied with incorrect data types, and typos.
Before using any function, you should know what that function actually does and make sure you are including all required arguments.
# No warning but unexpected results due to a typo
mean(c(1:10, NA), na.RM=T)
[1] NA
#corrected
mean(c(1:10, NA), na.rm=T)
[1] 5.5
#wrong data type supplied to argument x; results in a warning and NA output
mean(letters[1:5])
Warning in mean.default(letters[1:5]): argument is not numeric or logical:
returning NA
[1] NA
#no argument throws an error
mean()
Error in mean.default(): argument "x" is missing, with no default
Tip
Always, always, always read the documentation. Use ?function_name().
Misusing operators
Misuse of operators can be applied to many different scenarios. However, the most common seems to surround ==, which is used to assess equality.
For example,
x = 5
is used to assign 5 to the object x.
BUT
#returns TRUE or FALSE
x == 5
[1] TRUE
paste("x is assigned to the value", x)
[1] "x is assigned to the value 5"
x == 6
[1] FALSE
paste("x is assigned to the value", x)
[1] "x is assigned to the value 5"
#reassigns the object x to 8
x = 8
paste("x is assigned to the value", x)
[1] "x is assigned to the value 8"
== checks for equality. If we use =, when we mean ==, we could accidentally overwrite objects.
In certain contexts, this type of mistake will result in the following error:
x <- c(5,1,2,3)

for(i in seq_along(x)) {
    if(x[i] = 5) {
      cat(i, "\n")  }
}
Error: <text>:4:13: unexpected '='
3: for(i in seq_along(x)) {
4:     if(x[i] =
               ^
Another common error is of the format, Error in if..., which usually means that a logical (if statement) is not returning a logical value (TRUE/FALSE). These tend to be caused by the presence of NAs.
x <- c(NA,5,1,2,3)

for(i in seq_along(x)) {
    if(x[i] == 5) {
      cat(i, "\n")  }
}
Error in if (x[i] == 5) {: missing value where TRUE/FALSE needed
Calling functions with the wrong type of closure
If you use a function with brackets rather than parentheses,
mean[1:10]
Error in mean[1:10]: object of type 'closure' is not subsettable
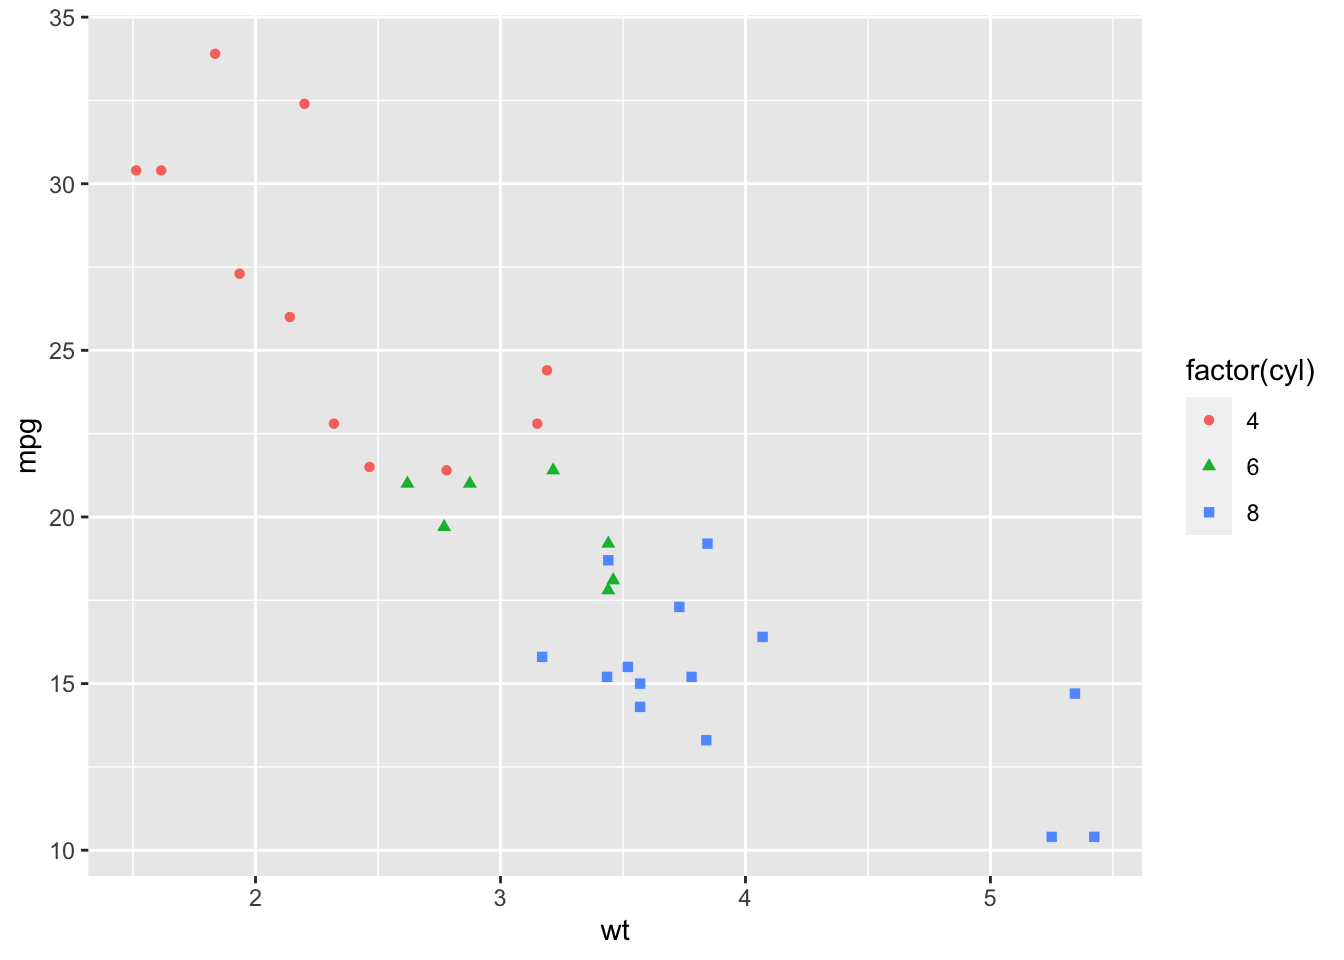
ggplot2 syntax errors
library(ggplot2)
ggplot(mtcars) +
  geom_point(aes(wt, mpg, color = factor(cyl)
                 shape = factor(cyl)))
Error: <text>:4:18: unexpected symbol
3:   geom_point(aes(wt, mpg, color = factor(cyl)
4:                  shape
                    ^
Unexpected symbol in errors generally mean there is a punctuation mistake, such as a missing comma. This error is not specific to ggplot2 but is likely to creep in when plotting.
library(ggplot2)
ggplot(mtcars) +
  geom_point(aes(wt, mpg, color = factor(cyl),
                 shape = factor(cyl)))
+ scale_color_manual(c("blue","yellow","red"))
Error:
! Cannot use `+` with a single argument
ℹ Did you accidentally put `+` on a new line?
In ggplot2 the + symbol follows each layer and must be on the right hand side of the expression.
Similarly, the native R pipe (|>) and the magrittr pipe (%>%) are continuation characters that are placed on the right hand side of an expression. Be careful regarding placement, and make sure code follows.
Object naming errors
Incorrectly naming objects results in errors
Names should:
- Avoid spaces or special characters EXCEPT '_' and '.'
- Not include numbers or symbols at the beginning of an object name.
- Avoid common names with special meanings (
?Reserved) or assigned to existing functions (These will auto complete in RStudio).
2 <- seq(100,200,25)
Error in 2 <- seq(100, 200, 25): invalid (do_set) left-hand side to assignment
Errors related to syntactically invalid names generally creep in when loading data with R. Base R import functions will automatically fix column names, which may lead to unexpected results. For example, here the sample names (column names) start with a number prior to import. This is against naming conventions.
data <- read.delim("../data/S5_CommonErrors/SF_example_RNASeq_1.txt")
head(data)
                     gene_id X1_Cell1_Rep1 X2_Cell1_Rep2 X3_Cell1_Rep3
1 ENSG00000001630.11_CYP51A1       6877.07       6614.00       7057.98
2   ENSG00000002016.12_RAD52        282.99        286.62        286.52
3      ENSG00000002330.9_BAD       1946.00       1662.00       2121.00
4   ENSG00000002834.13_LASP1      17636.00      19333.00      18917.00
5     ENSG00000003056.3_M6PR       3874.00       4107.00       4005.00
6    ENSG00000003393.10_ALS2       2041.00       2150.00       2141.00
  X4_Cell2_Rep1 X5_Cell2_Rep2 X6_Cell2_Rep3
1      11305.33      10760.54      10047.00
2        265.41        235.00        254.24
3        608.00        711.00        576.00
4       4583.00       4464.00       3892.00
5       5741.00       5703.00       4978.00
6       1687.00       1624.00       1426.00
While this behavior can be modified with the check.names argument, invalid names will likely cause issues downstream.
In contrast, readr functions will not correct names unless defaults are modified with the .name_repair argument. For example,
data1 <- readr::read_delim("../data/S5_CommonErrors/SF_example_RNASeq_1.txt")
Rows: 10000 Columns: 7
── Column specification ────────────────────────────────────────────────────────
Delimiter: "\t"
chr (1): gene_id
dbl (6): 1_Cell1_Rep1, 2_Cell1_Rep2, 3_Cell1_Rep3, 4_Cell2_Rep1, 5_Cell2_Rep...

ℹ Use `spec()` to retrieve the full column specification for this data.
ℹ Specify the column types or set `show_col_types = FALSE` to quiet this message.
head(data1)
# A tibble: 6 × 7
  gene_id            `1_Cell1_Rep1` `2_Cell1_Rep2` `3_Cell1_Rep3` `4_Cell2_Rep1`
  <chr>                       <dbl>          <dbl>          <dbl>          <dbl>
1 ENSG00000001630.1…          6877.          6614           7058.         11305.
2 ENSG00000002016.1…           283.           287.           287.           265.
3 ENSG00000002330.9…          1946           1662           2121            608
4 ENSG00000002834.1…         17636          19333          18917           4583
5 ENSG00000003056.3…          3874           4107           4005           5741
6 ENSG00000003393.1…          2041           2150           2141           1687
# ℹ 2 more variables: `5_Cell2_Rep2` <dbl>, `6_Cell2_Rep3` <dbl>
and this will result in an error:
data1$1_Cell1_Rep1
Error: <text>:2:7: unexpected numeric constant
1:
2: data1$1
         ^
#use back ticks to get around this
head(data1$`1_Cell1_Rep1`)
[1] 6877.07 282.99 1946.00 17636.00 3874.00 2041.00
Warning
This issue is likely to come up with bioinformatics data, so consider renaming sample names early in your data analysis workflow if required.
Import errors
Though a bit unrelated to this section, import errors are also quite frequent for beginners due to misunderstandings regarding the working directory. Always know what directory you are working in (getwd()) and where the files you want to work with are located in relation to that directory. You may also want to check for typos in the file name, the file extension, and whether you correctly used / rather than \. While Windows OS uses the \ in file paths, in R, a \ is an escape character.
data2 <- read.delim("../S5_CommonErrors/SF_example_RNASeq_1.txt")
Warning in file(file, "rt"): cannot open file
'../S5_CommonErrors/SF_example_RNASeq_1.txt': No such file or directory
Error in file(file, "rt"): cannot open the connection
Overwriting objects leads to unexpected results
x <- 1:3
x <- 1:10
mean(x)
[1] 5.5
Tip
Check your environment pane for created objects. Be careful, as it is easy to overwrite existing objects.
Indexing errors
Indices in R start with 1. Incorrect usage of indexing in data structures such as vectors or data frames will not necessarily result in an error, but will often lead to unexpected results. A general subscript out of bounds error generally refers to accessing an element of a vector, list, or other data structure that isn't there.
Going beyond the range of vec1 below results in NA.
vec1 <- c(1:10)
vec1[11]
[1] NA
and subsetting outside the range of a data frame results in NAs or NULL.
mtcars[1:10, 12]
NULL
tail(mtcars[1:40, ])
     mpg cyl disp hp drat wt qsec vs am gear carb
NA.2  NA  NA   NA NA   NA NA   NA NA NA   NA   NA
NA.3  NA  NA   NA NA   NA NA   NA NA NA   NA   NA
NA.4  NA  NA   NA NA   NA NA   NA NA NA   NA   NA
NA.5  NA  NA   NA NA   NA NA   NA NA NA   NA   NA
NA.6  NA  NA   NA NA   NA NA   NA NA NA   NA   NA
NA.7  NA  NA   NA NA   NA NA   NA NA NA   NA   NA
Indexing outside the range of a matrix results in an error.
m <- matrix(1:6, nrow=2)
m[3, 3]
Error in m[3, 3]: subscript out of bounds
To avoid unexpected results or errors associated with incorrect indexing, know the structure of your data. Use functions such as str(), dim(), nrow(), ncol().
Other errors from subsetting outside of the bounds of a data frame include:
mtcars[,13]
Error in `[.data.frame`(mtcars, , 13): undefined columns selected
and
mtcars[[13]]
Error in .subset2(x, i, exact = exact): subscript out of bounds
Read more on subsetting here.
Package errors
Errors regarding packages usually revolve around:
- function masking issues (e.g.,
dplyr::select()vsMASS::select()).- call the package directly.
- dependency loading issues (e.g.,
Error: package or namespace load failed for ‘PACKAGE.NAME.HERE’)- install dependencies.
- failure to compile issues.
- reinstall and do not compile from source
Data type coercion errors
Converting between data types can often result in unexpected results. The following warning is common, if you are attempting to coerce a variable to a different data type that isn't possible.
as.numeric(c("1","two"))
Warning: NAs introduced by coercion
[1] 1 NA
Again, it is important to know the data type of an R object (Use typeof(), mode(), and class()).
Improper handling of missing Data (NAs).
vec1 <- c(1,2,NA,4)

sum(vec1)
[1] NA
Memory management errors
Error: vector memory exhausted (limit reached?) occurs when you do not have enough RAM available. You can track memory usage using Rstudio and remove objects as needed with rm(). You could also potentially switch over to the NIH HPC Biowulf.
You may also find this guide helpful.
Trouble-shooting
General steps to debug R code:
- Read the message carefully.
- Check for typos and missing punctuation.
- Check your global environment for created objects (or use
ls()). - Check object attributes (Use
str(),dim(),typeof(),class(), etc.) -
Step through the code line by line (See below example).
library(nycflights13)
library(dplyr)
Attaching package: 'dplyr'The following objects are masked from 'package:stats': filter, lagThe following objects are masked from 'package:base': intersect, setdiff, setequal, unionflights |> filter(dest == "IAH") |> group_by(year, month, day) |> summarize( arr_delay = mean(arr_dely, na.rm = TRUE) )Error in `summarize()`: ℹ In argument: `arr_delay = mean(arr_dely, na.rm = TRUE)`. ℹ In group 1: `year = 2013`, `month = 1`, `day = 1`. Caused by error in `mean()`: ! object 'arr_dely' not foundflights |> filter(dest == "IAH")# A tibble: 7,198 × 19 year month day dep_time sched_dep_time dep_delay arr_time sched_arr_time <int> <int> <int> <int> <int> <dbl> <int> <int> 1 2013 1 1 517 515 2 830 819 2 2013 1 1 533 529 4 850 830 3 2013 1 1 623 627 -4 933 932 4 2013 1 1 728 732 -4 1041 1038 5 2013 1 1 739 739 0 1104 1038 6 2013 1 1 908 908 0 1228 1219 7 2013 1 1 1028 1026 2 1350 1339 8 2013 1 1 1044 1045 -1 1352 1351 9 2013 1 1 1114 900 134 1447 1222 10 2013 1 1 1205 1200 5 1503 1505 # ℹ 7,188 more rows # ℹ 11 more variables: arr_delay <dbl>, carrier <chr>, flight <int>, # tailnum <chr>, origin <chr>, dest <chr>, air_time <dbl>, distance <dbl>, # hour <dbl>, minute <dbl>, time_hour <dttm>flights |> filter(dest == "IAH") |> group_by(year, month, day)# A tibble: 7,198 × 19 # Groups: year, month, day [365] year month day dep_time sched_dep_time dep_delay arr_time sched_arr_time <int> <int> <int> <int> <int> <dbl> <int> <int> 1 2013 1 1 517 515 2 830 819 2 2013 1 1 533 529 4 850 830 3 2013 1 1 623 627 -4 933 932 4 2013 1 1 728 732 -4 1041 1038 5 2013 1 1 739 739 0 1104 1038 6 2013 1 1 908 908 0 1228 1219 7 2013 1 1 1028 1026 2 1350 1339 8 2013 1 1 1044 1045 -1 1352 1351 9 2013 1 1 1114 900 134 1447 1222 10 2013 1 1 1205 1200 5 1503 1505 # ℹ 7,188 more rows # ℹ 11 more variables: arr_delay <dbl>, carrier <chr>, flight <int>, # tailnum <chr>, origin <chr>, dest <chr>, air_time <dbl>, distance <dbl>, # hour <dbl>, minute <dbl>, time_hour <dttm>flights |> filter(dest == "IAH") |> group_by(year, month, day) |> summarize( arr_delay = mean(arr_dely, na.rm = TRUE) )Error in `summarize()`: ℹ In argument: `arr_delay = mean(arr_dely, na.rm = TRUE)`. ℹ In group 1: `year = 2013`, `month = 1`, `day = 1`. Caused by error in `mean()`: ! object 'arr_dely' not found -
Google the error message if necessary.
- Remove information specific to your data (e.g., object names) or files from the message.
- Be sure to include important search keywords. For example, if you know what function or data type the error is associated with, you can include that information. You should 100% include R as a keyword in any search.
-
Post to a forum.
- Take a break.
Tip
At times, updating packages or simply restarting the R Session can address particularly troublesome errors.
Tip
You can also use common debugging tools (e.g., traceback(), debug()). These will likely be more useful for intermediate R users.
Getting help.
ALWAYS, ALWAYS, ALWAYS read the documentation.
-
Use the help pane in the lower right of RStudio or the functions,
help()andhelp.search()or?and??. -
Check out package vignettes (
vignette()). -
Check the Github site if one is available for help with a specific package. There may also be known issues listed under the Github Issues tab.
-
Google for help!
Use Google to troubleshoot error message or simply find help performing a specific task. But, make sure you are precise and informative in your search. Stack Overflow is a particularly great resource. A good Google search includes 3 elements:
- The specific action (e.g., how to rename a column).
- The programming language (e.g., R statistics).
- The specific style/technique for coding (e.g., dplyr or tidyverse package)
Example: "How to rename a column in R with dplyr/tidyverse”. --- https://crd230.github.io/tips.html.
Post a Question to a forum.
If you can't find help, you may need to post to a forum like Posit Community, Stack Overflow, or Bioconductor.
To post a question, you should include at minimum the following:
- a descriptive and informative title with keywords (related to packages, functions, methods, or errors)
- a description of the problem
sessionInfo()- readable, well-formatted code
- a reproducible example (reprex) including a minimal dataset
See tips here. Do not include screen shots of your code or console, as this cannot be easily copied and reproduced.
Note
Stack overflow has a help page that includes guidelines for asking good questions.
How to make a reprex?
The package reprex is used to
Prepare reprexes for posting to GitHub issues, StackOverflow, in Slack messages or snippets, or even to paste into PowerPoint or Keynote slides. ---https://reprex.tidyverse.org/index.html
Creating a minimal dataset.
This can usually be achieved by using built in datasets (data()) or creating a small data set example using data.frame() or related function. The help pages of functions usually include a miminal example dataset. If for some reason you need to use your own data, check out the package datapasta.
To use reprex, you simply copy the code you want to include on Github, Stack Overflow, or other forum, and call reprex(). By default, it will create reproducible code ready for Github, Stack Overflow, or Discourse.
For example, using datapasta with reprex to create an example dataset with our own data:
library(reprex)
library(datapasta)

data <- read.delim("../data/S5_CommonErrors/SF_example_RNASeq_1.txt",check.names = FALSE)
data <- head(data)
dpasta(data)
data.frame(
  stringsAsFactors = FALSE,
       check.names = FALSE,
           gene_id = c("ENSG00000001630.11_CYP51A1",
                       "ENSG00000002016.12_RAD52","ENSG00000002330.9_BAD",
                       "ENSG00000002834.13_LASP1","ENSG00000003056.3_M6PR",
                       "ENSG00000003393.10_ALS2"),
    `1_Cell1_Rep1` = c(6877.07, 282.99, 1946, 17636, 3874, 2041),
    `2_Cell1_Rep2` = c(6614, 286.62, 1662, 19333, 4107, 2150),
    `3_Cell1_Rep3` = c(7057.98, 286.52, 2121, 18917, 4005, 2141),
    `4_Cell2_Rep1` = c(11305.33, 265.41, 608, 4583, 5741, 1687),
    `5_Cell2_Rep2` = c(10760.54, 235, 711, 4464, 5703, 1624),
    `6_Cell2_Rep3` = c(10047, 254.24, 576, 3892, 4978, 1426)
)
#copy to clipboard and run reprex
data<- data.frame(
  stringsAsFactors = FALSE,
       check.names = FALSE,
           gene_id = c("ENSG00000001630.11_CYP51A1",
                       "ENSG00000002016.12_RAD52","ENSG00000002330.9_BAD",
                       "ENSG00000002834.13_LASP1","ENSG00000003056.3_M6PR",
                       "ENSG00000003393.10_ALS2"),
    `1_Cell1_Rep1` = c(6877.07, 282.99, 1946, 17636, 3874, 2041),
    `2_Cell1_Rep2` = c(6614, 286.62, 1662, 19333, 4107, 2150),
    `3_Cell1_Rep3` = c(7057.98, 286.52, 2121, 18917, 4005, 2141),
    `4_Cell2_Rep1` = c(11305.33, 265.41, 608, 4583, 5741, 1687),
    `5_Cell2_Rep2` = c(10760.54, 235, 711, 4464, 5703, 1624),
    `6_Cell2_Rep3` = c(10047, 254.24, 576, 3892, 4978, 1426)
)

#also include code to reproduce
(data2 <- rename_with(data,~ paste0("S",.x),contains("Cell")))
Run reprex after copying to clipboard.
reprex(session_info=TRUE,style=TRUE)
Tips for keeping your code organized and avoiding errors
-
Read the documentation!
- Know what the functions you use actually do.
- Read package vignettes.
-
Practice!
- The more you engage with R programming the more proficient you will become. With time, handling error messages will become second nature.
-
Keep your code neat and clean. You can do this by following a style guide, for example, the tidyverse style guide.
- If you use RStudio, you can use
ctrl+shift+Ato reformat code. - See this resource on Coding Etiquette for styling tips.
- Include organized code blocks with coding sections (
# Name of Section ----).
- If you use RStudio, you can use
-
Implement good data management practices.
- Use R projects to organize data, code, outputs, and other related files in one place.
- Use relative file paths to keep code from unexpectedly breaking and understand your directory tree.
-
Know the structure of your data.
- Keep track of created R objects (See the global environment; use
ls()). - Use
glimpse(),str(),dim(), and related functions (class()).
- Keep track of created R objects (See the global environment; use
Sources
- Top 10 errors in R and how to fix them.
- How to: Interpret Common Errors in R
- The Epidemiologist R Handbook: 47 Common Errors
- Modern Statistics with R: Debugging
- Common errors in R: An Empirical Investigation
- CODING ETIQUETTE WRITING CLEAR, INFORMATIVE AND EASY TO USE CODE
- R for Graduate Students: Troubleshooting Error Messages.
- Spring 2021 EDAV Community Contributions: Common Errors in R
- R Tips and Fixes
- FAQ: Tips for writing R-related questions
- Error: unexpected symbol/input/string constant/numeric constant/SPECIAL in my code