Lesson 4: Stat Transformations: Bar plots, box plots, and histograms
The following questions will have you explore the mtcars dataset through creating plots that were presented in Lesson 4. At the end of these exercises, you should be more comfortable creating plots that convey statistical summary information about data.
Activate packages
library(ggplot2)
Load the mtcars dataset using the code below. This is a dataset that comes with R.
data(mtcars)
Question 1
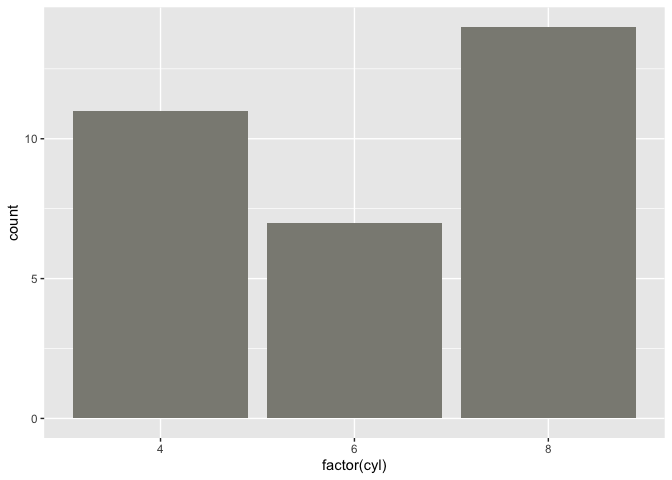
How many cars in this dataset have 4, 6, or 8 cylinders (cyl)?
Solution
ggplot(mtcars,aes(x=factor(cyl)))+geom_bar(fill="ivory4")
Question 2
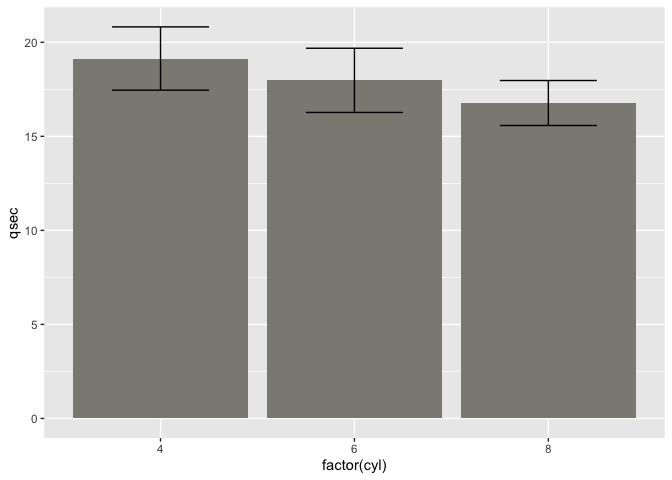
Does the number of cylinders (cyl) that a car has influence it's quarter mile time (qsec)?
Solution
ggplot(mtcars,aes(x=factor(cyl),y=qsec))+stat_summary(fun=mean,position=position_dodge(width=0.95),geom="bar",fill = "ivory4")+stat_summary(fun.data=mean_sdl,fun.args=list(mult=1),tion=position_dodge(width=0.95),geom="errorbar",width=0.5)
## Warning: Ignoring unknown parameters: tion
Question 3
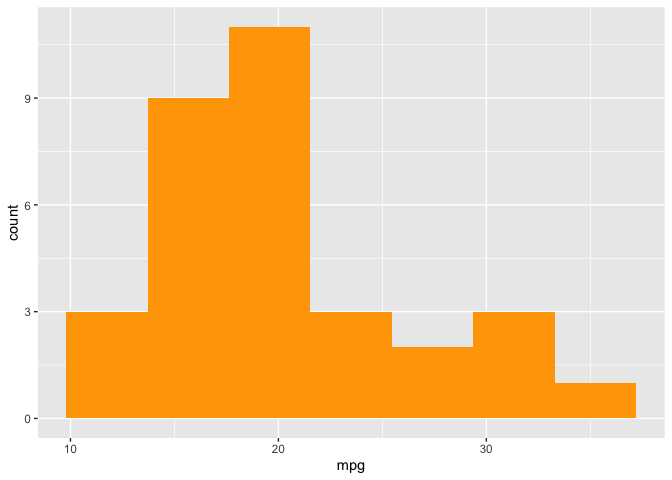
What is the distribution of fuel efficiency (mpg)? Use 7 bins for this exercise.
Solution
ggplot(mtcars,aes(x=mpg))+geom_histogram(fill="orange",bins=7)
Question 4
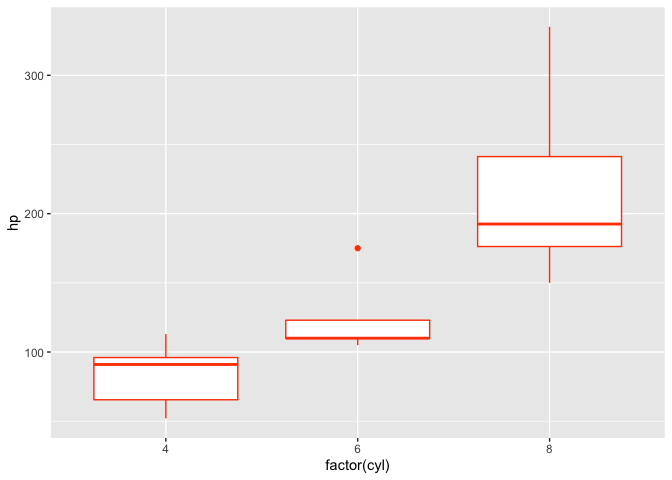
Can you create a box plot of horsepower (hp) as a function of the number of cylinders (cyl) a car has?
Solution
ggplot(mtcars,aes(x=factor(cyl),y=hp))+geom_boxplot(colour="orangered")