Lesson 10: Introducing the FASTQ file and assessing sequencing data quality
Before getting started, remember to be signed on to the DNAnexus GOLD environment.
Lesson 9 Review
In the previous lesson, we explored the reference genomes and genome annotation files that are needed in our analysis of the Human Brain Reference (HBR) and Universal Human Reference (UHR) RNA sequencing data.
Learning objectives
In lesson 9, we learned that reference genomes came in the form of FASTA files, which essentially store nucleotide sequences. In this lesson, we will learn about the FASTQ file, which is the file format that we get from our high throughput sequencing experiment. Our goals are to
- Learn about the structure of FASTQ files
- Use the command line to retrieve some basic FASTQ file statistics
- Use FASTQC, a prebuilt application, to generate quality metrics for FASTQ files
- Interpret quality check results generated from FASTQC
The skills learned can be applied to your own research and will be used when we learn more about RNA sequencing in subsequent lessons. In this lesson, we will continue to use the Human Brain Reference and Universal Human Reference datasets.
The directory in which the HBR and UHR dataset resides is ~/biostar_class/hbr_uhr. Let's go ahead and change into this folder. Because we are talking about the sequencing data in this lesson, we will then need to change into the reads folder.
cd ~/biostar_class/hbr_uhr
cd reads
Let's now list (using ls) the contents of the reads folder. We use -1 to make ls list one item per row.
ls -1
HBR_1_R1.fq
HBR_1_R2.fq
HBR_2_R1.fq
HBR_2_R2.fq
HBR_3_R1.fq
HBR_3_R2.fq
UHR_1_R1.fq
UHR_1_R2.fq
UHR_2_R1.fq
UHR_2_R2.fq
UHR_3_R1.fq
UHR_3_R2.fq

Figure 1: Paired end sequencing. Source: https://www.ebi.ac.uk/training/online/courses/functional-genomics-ii-common-technologies-and-data-analysis-methods/rna-sequencing/performing-a-rna-seq-experiment/design-considerations/.
Each FASTQ file is composed of many sequences. We can use the seqkit tool and its stats function to get statistics on our FASTQ files. In the seqkit command below, we use * to denote wild card in order to have seqkit run stats for all FASTQ files.
seqkit stats HBR*.fq UHR*.fq
Our query of the stats for the FASTQ files generates the results below where we are informed of things such as the number of sequences (or reads) in a FASTQ file. For the HBR_1 biological replicates, both files in the pair (R1 and R2) have 118,571 sequences. The average length of the sequences in these files is 100 bases. Pairs in paired end sequencing should have the same number of sequences because the reads generated from the pairs came from the same template.
file               format  type   num_seqs sum_len      min_len  avg_len  max_len
HBR_1_R1.fq        FASTQ   DNA    118,571  11,857,100   100      100      100
HBR_1_R2.fq        FASTQ   DNA    118,571  11,857,100   100      100      100
HBR_2_R1.fq        FASTQ   DNA    144,826  14,482,600   100      100      100
HBR_2_R2.fq        FASTQ   DNA    144,826  14,482,600   100      100      100
HBR_3_R1.fq        FASTQ   DNA    129,786  12,978,600   100      100      100
HBR_3_R2.fq        FASTQ   DNA    129,786  12,978,600   100      100      100
UHR_1_R1.fq        FASTQ   DNA    227,392  22,739,200   100      100      100
UHR_1_R2.fq        FASTQ   DNA    227,392  22,739,200   100      100      100
UHR_2_R1.fq        FASTQ   DNA    162,373  16,237,300   100      100      100
UHR_2_R2.fq        FASTQ   DNA    162,373  16,237,300   100      100      100
UHR_3_R1.fq        FASTQ   DNA    185,442  18,544,200   100      100      100
UHR_3_R2.fq        FASTQ   DNA    185,442  18,544,200   100      100      100
Recall from the seqkit stat results shown above that each FASTQ file contains many sequencing reads. The record for each sequencing read is composed of four lines and these include the following.
- The first line is the sequencing read metadata (ie. instrument used, location on the flow cell where the read was derived, and whether the read is the first or second of a pair in paired end sequencing) - in our example,
- "/1" at the end of the metadata line in the reads from HBR_1_R1.fastq.gz denotes the first read of a pair
- "/2" at the end of the metadata line in the reads from HBR_1_R2.fastq.gz denotes the second read of a pair
- The second line is the sequence
- The third line is a "+"
- The fourth line contains the quality score of each of the bases in the sequencing read. This quality score tells us the confidence of the base call
Below we use the head command (where -4 indicates we want only the first 4 lines) to show the first sequencing read of HBR_1_R1.fq and HBR_1_R2.fq.
head -4 HBR_1_R1.fq
@HWI-ST718_146963544:7:2201:16660:89809/1
CAAAGAGAGAAAGAAAAGTCAATGATTTTATAGCCAGGCAAAATGACTTTCAAGTAAAAAATATAAAGCACCTTACAAACTAGTATCAAAATGCATTTCT
+
CCCFFFFFHHHHHJJJJJHIHIJJIJJJJJJJJJJJJIJJJJJJJJJJJJJIJJIIJJJJJJJJJJJJIIJFHHHEFFFFFEEEEEEEDDDDCDDEEDEE
head -4 HBR_1_R2.fq
@HWI-ST718_146963544:7:1101:5039:82953/2
GGTGGGGACAGGGTACTTGGCATAAAGTAGGCTCTTAGTACATTTTTTGAATGAATGAATGACTCTGAAAGGTAAATAATAATCAACTTTAGCATAAATG
+
@B=DFDFFHHGFHGHJJJJJJIIIJJIIIJIIJIJJJJGHIIJJJJJJJGHGIIJIJIJJJHHHHHHHFFFFFECEEEEEEDEDDDDDDDDDDDEDDDEE
If we view the first 8 lines in HBR_1_R1.fq, we can see that we have the same structure for the second sequencing read in the file.
head -8 HBR_1_R1.fq
@HWI-ST718_146963544:7:2201:16660:89809/1
CAAAGAGAGAAAGAAAAGTCAATGATTTTATAGCCAGGCAAAATGACTTTCAAGTAAAAAATATAAAGCACCTTACAAACTAGTATCAAAATGCATTTCT
+
CCCFFFFFHHHHHJJJJJHIHIJJIJJJJJJJJJJJJIJJJJJJJJJJJJJIJJIIJJJJJJJJJJJJIIJFHHHEFFFFFEEEEEEEDDDDCDDEEDEE
@HWI-ST718_146963544:7:2215:16531:12741/1
CAAAATATTTTTTTTTTCTGTATATGACAAGACACACATCAGATCATAAGCTACAAGAAAACAAACAAAAAAGATATGAAAAAGATATAAAGACCTCCCC
+
@@@DDDDDFFFFFIIII;??::::9?99?G8;)9/8'787.)77;@==D=?;?A>D?@BDC@?CC=?BBBBB?<:4::@BBBB<?:>:@DD343<>:?BB
Click here and here to learn more about the quality scores. The image below shows a table that translates the characters you see in the quality score lines to a numeric score.

Previously, we used seqkit stats to get statistics for HBR_1_R1.fastq.gz and HBR_1_R2.fastq.gz, such as the number of sequencing reads in the files. In theory, if we grep for @HWI of the metadata line and then count the number of lines using wc -l (again, we use wc to obtain word count and -l instructs this command to provide only the number of lines in a file), we should get the same result as that from seqkit stats (warning: this might not work all of the time).
grep @HWI HBR_1_R1.fq | wc -l
118571
grep @HWI HBR_1_R2.fq | wc -l
118571
Here we have learned how to use an existing application as well as stand alone commands to get some basic statistics from FASTQ files. However, doing this repeatedly for every FASTQ file can become cumbersome so we typically turn to tools like FASTQC to generate sequencing quality metrics.
FASTQC is a tool developed by the Babraham Institute. Their documentation can be found at https://www.bioinformatics.babraham.ac.uk/projects/fastqc/Help/. A video tutorial can be found at https://youtu.be/bz93ReOv87Y.
We can take a look at the instructions for running FASTQC by typing the following at our command prompt.
fastqc --help
Once the instructions have been pulled up, we see that to run FASTQC we simply do the following.
fastqc input1
If we have multiple FASTQ files then we can enter them in a series.
fastqc input1 input2 input3 ... inputN
Let's run FASTQC on the HBR and UHR sequencing data.
fastqc HBR_*.fq UHR_*.fq
FASTQC will print out the status of the analysis. Analysis status for HBR_1_R1.fq is shown below but note that this status will be printed for all inputs in the FASTQC command.
Started analysis of HBR_1_R1.fq
Approx 5% complete for HBR_1_R1.fq
Approx 10% complete for HBR_1_R1.fq
Approx 15% complete for HBR_1_R1.fq
Approx 20% complete for HBR_1_R1.fq
Approx 25% complete for HBR_1_R1.fq
Approx 30% complete for HBR_1_R1.fq
Approx 35% complete for HBR_1_R1.fq
Approx 40% complete for HBR_1_R1.fq
Approx 45% complete for HBR_1_R1.fq
Approx 50% complete for HBR_1_R1.fq
Approx 55% complete for HBR_1_R1.fq
Approx 60% complete for HBR_1_R1.fq
Approx 65% complete for HBR_1_R1.fq
Approx 70% complete for HBR_1_R1.fq
Approx 75% complete for HBR_1_R1.fq
Approx 80% complete for HBR_1_R1.fq
Approx 85% complete for HBR_1_R1.fq
Approx 90% complete for HBR_1_R1.fq
Approx 95% complete for HBR_1_R1.fq
Analysis complete for HBR_1_R1.fq
...
Now if we list the files in the hbr_uhr directory, we will see that each FASTQ file has a corresponding FASTQC html report and zip folder. We can view the html version of the QC report in a web browser and this is what most people would do. The QC results (text and figures that appears in the html report) are also available in the zip folder.
ls
HBR_1_R1.fq           HBR_1_R2_fastqc.zip   HBR_2_R2_fastqc.html  HBR_3_R2.fq           UHR_1_R1_fastqc.zip   UHR_2_R1_fastqc.html  UHR_3_R1.fq           UHR_3_R2_fastqc.zip
HBR_1_R1_fastqc.html  HBR_2_R1.fq           HBR_2_R2_fastqc.zip   HBR_3_R2_fastqc.html  UHR_1_R2.fq           UHR_2_R1_fastqc.zip   UHR_3_R1_fastqc.html
HBR_1_R1_fastqc.zip   HBR_2_R1_fastqc.html  HBR_3_R1.fq           HBR_3_R2_fastqc.zip   UHR_1_R2_fastqc.html  UHR_2_R2.fq           UHR_3_R1_fastqc.zip
HBR_1_R2.fq           HBR_2_R1_fastqc.zip   HBR_3_R1_fastqc.html  UHR_1_R1.fq           UHR_1_R2_fastqc.zip   UHR_2_R2_fastqc.html  UHR_3_R2.fq
HBR_1_R2_fastqc.html  HBR_2_R2.fq           HBR_3_R1_fastqc.zip   UHR_1_R1_fastqc.html  UHR_2_R1.fq           UHR_2_R2_fastqc.zip   UHR_3_R2_fastqc.html
Let's unzip HBR_1_R1_fastqc.zip and take a peek at the content.
unzip HBR_1_R1_fastqc.zip
cd HBR_1_R1_fastqc
ls
In the HBR_1_R1_fastqc folder, the QC summary is available in the summary.txt file. The QC results is in fastqc_data.txt and the figures are in the Images folder.
Icons                   fastqc.fo               fastqc_report.html
Images                  fastqc_data.txt         summary.txt
cd Images
ls
adapter_content.png                     per_sequence_gc_content.png
duplication_levels.png                  per_sequence_quality.png
per_base_n_content.png                  per_tile_quality.png
per_base_quality.png                    sequence_length_distribution.png
per_base_sequence_content.png
Now, let's change back into the ~/biostar_class/hbr_uhr/reads folder and move HBR_1_R1_fastqc.html to our ~/public directory and then right click to open it in a new browser tab. In the cp command below ~ denotes home directory.
cd ~/biostar_class/hbr_uhr/reads
cp HBR_1_R1_fastqc.html ~/public
If we now listed the contents of the ~/public directory, then we will see HBR_1_R1_fastqc.html.
ls ~/public
In the FASTQC report, the first thing we see is the Summary panel that allows us to navigate to different portions of the FASTQC report. In this summary panel, we see that we have one failed module (red circle with x) and three warnings (yellow circle with !). In the main report pane, the first information is the Basic Statistics (Figure 2), which tells us
- Name of the FASTQ file that we are working with (HBR_1_R1.fq in this case)
- The number of sequences in the file
- Number of sequences flagged with poor quality (0 in the HBR_1_R1.fq file)
- The sequence length (ie. how many bases are in each sequencing read of the FASTQ file). For HBR_1_R1.fq, each sequencing read is composed of 100 bases and this concurs with the results from seqkit stats.
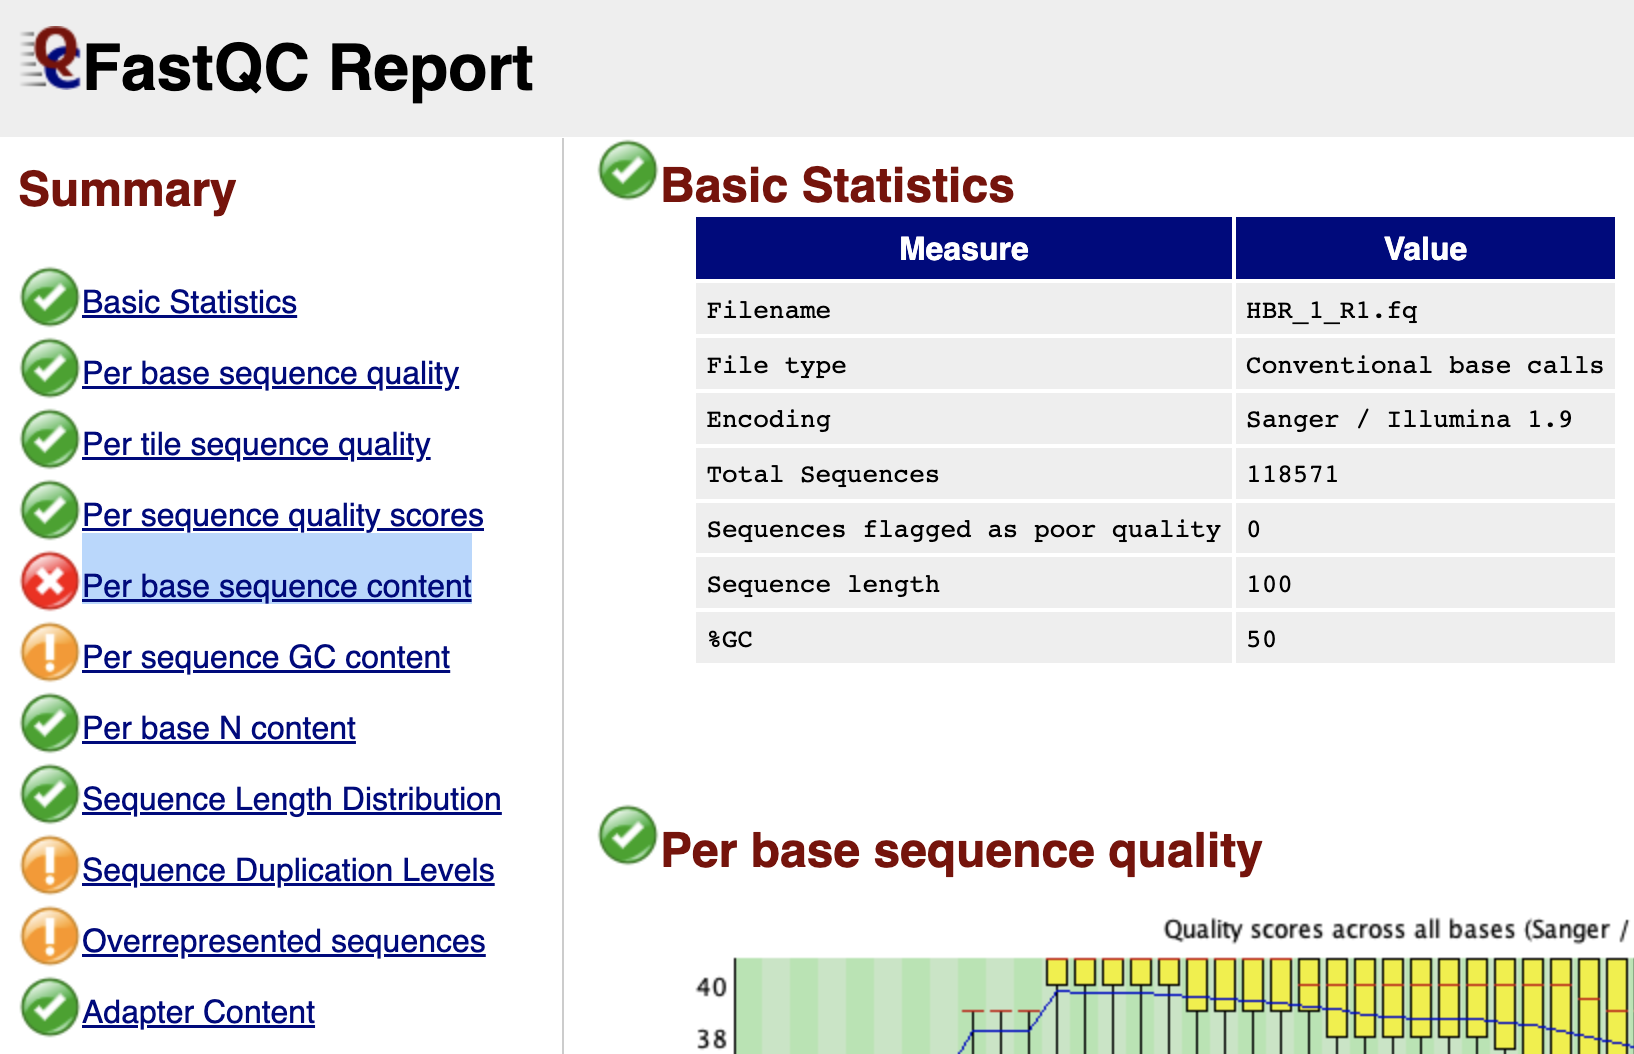
Figure 2
Next, we can see the "Per base sequence quality" plot (Figure 3).
This chart plots the error likelihood at each position averaged over all measurements.
-
The vertical axis are the quality scores that you see in row 4 of the sequencing reads in a FASTQ file. These quality scores represent error probabilities, where:
- 10 corresponds to 10% error (1/10),
- 20 corresponds to 1% error (1/100),
- 30 corresponds to 0.1% error (1/1000) and
- 40 corresponds to one error every 10,000 measurements (1/10,000) that is an error rate of 0.01%
-
The three colored bands (green, yellow, red) illustrate the typical labels assigned to these measure:
- reliable (28-40, green)
- less reliable (20-28, yellow)
- and error prone (1-20, red)
-
The yellow boxes contain 50% of the data, the whiskers indicate the 75% outliers.
-
The red line inside the yellow boxes is the median quality score for that base.
-
The blue line is the average quality score at a particular base.

Figure 3
Next, in Figure 4, we have the "Per tile sequence quality" plot. This graph tells us whether something is wrong with a tile in the flow cell. Along the horizontal axis are the base positions. The vertical axis represents the tile number in which the read came from.
This plot compares the average quality score of a tile to the average quality score of all tiles at a particular base position. -- https://sequencing.qcfail.com/articles/position-specific-failures-of-flowcells/
The interpretation for this plot is as follows
- Colder colors indicate that the average quality score at a tile is at or above the average quality score of all tiles at a particular base position. So a plot that is entirely blue is good (Figure 4).
- Hotter colors indicate that the average quality score at a tile is below the average quality score of all tiles at a particular base position. So a plot with red indicates a part of the flow cell has problems (Figure 5).

Figure 4

Figure 5. Source: https://www.bioinformatics.babraham.ac.uk/projects/fastqc/Help/3%20Analysis%20Modules/12%20Per%20Tile%20Sequence%20Quality.html
Next, in Figure 6 we see a distribution of the sequence quality scores in the "Per sequence quality scores" plot, showing whether the quality of a subset of sequences is poor. Here our sequences have good quality, where most reads have quality that clusters at around 37.

Figure 6
Figure 7 shows us the sequence make up along the bases of our reads in the "Per base sequence content" plot. If a library is random, then the percent composition of each nucleotide base (A,T,C,G) should be the same (~25%).
This module fails for HBR_1_R1.fq because difference between the percentage of A and the percentage of T is larger than 20 at a particular location OR the difference between the percentage of C and the percentage of G is larger than 20 at a particular location -- Babraham bioinformatics Per base sequence content.
In HBR_1_R1.fq, it looks like the difference between the percent composition of A and T at base position 2 is causing the failure. Unfortunately, this type of uneveness in base distribution at the beginning of a read is observed in RNA sequencing due to priming with random hexamers during the library preparation stage.

Figure 7
Figure 8 shows the GC content across each sequence compared to a normal distribution in what is called the "Per sequence GC content" plot. The GC content in HBR_1_R1.fq is off from the normal theoretical distribution.
The peak of this theoretical distribution is an estimate of the GC content of the underlying genome. Deviation from of the GC content from the theoretical distribution could be caused by contamination or sequencing bias. -- Babraham bioinformatics Per base sequence content.

Figure 8
Whether we have any unknown bases in our sequencing reads is shown in Figure 9, which is the "Per base n content" plot".

Figure 9
Figure 10 shows the sequence length distribution of HBR_1_R1.fq in what is known as the "Sequence Length Distribution" plot.

Figure 10
Figure 11 shows the sequence duplication levels. High levels of duplication may indicate an enrichment bias such as over-amplification in the PCR step. Otherwise, most sequences will occur only once.

Figure 11
Figure 12 shows that we have some overrepresented sequences. As an exercise, let's copy one of the overrepresented sequences and BLAST it to find out what it is. Presence of overrepresented sequences may indicate enrichment artifact or the sequencing library is not very diverse. On the other hand, overrepresented sequences could have biological significance.

Figure 12
Figure 13 tells us whether some of our sequencing reads have adapter content. Adapters sequences should be trimmed prior to alignment.

Figure 13
HBR and UHR FASTQC reports
See the links below for the HBR and UHR FASTQC reports.