Lesson 11: Merging FASTQ quality reports and data cleanup
Before getting started, remember to be signed on to the DNAnexus GOLD environment.
Lesson 10 Review
In the previous lesson, we learned about the structure of the FASTQ file, which stores our raw sequencing reads. Next, we learned to use a tool called FASTQC to assess the quality of each of the FASTQ files in the Human Brain Reference (HBR) and Universal Human Reference (UHR) dataset.
Learning objectives
As described in the Lesson 10 review above, we generated quality reports for each of the FASTQ files in the Human Brain Reference and Universal Human Reference dataset using FASTQC. However, interrogating 12 individual FASTQC reports is cumbersome. In this lesson, we will focus on the following.
- Merge FASTQC reports using a tool called MultiQC so that we can interrogate one report rather than multiple.
- Learn to perform quality and adapter trimming on FASTQ files.
The skills learned can be applied to your own research and will be used when we learn more about RNA sequencing in subsequent lessons. In this lesson, we will continue to work with the HBR and UHR datasets.
Merging individual FASTQC reports
We previously stored FASTQC results for the HBR and UHR raw sequencing data in the ~/biostar_class/hbr_uhr/QC directory (recall that ~ denotes home directory). So before getting started, change into this folder.
cd ~/biostar_class/hbr_uhr/QC
FASTQC generated 12 html reports, here, we will merge them using the tool MultiQC.
MultiQC searches a given directory for analysis logs and compiles a HTML report. It's a general use tool, perfect for summarising the output from numerous bioinformatics tools. -- https://multiqc.info.
MultiQC "knows" the report formats of many existing NGS tools: FastQC, cutadapt, bowtie2, tophat, STAR, kallisto, HISAT2, samtools, featureCounts, HTSeq, MACS2, Picard, GATK, etc. -- https://wikis.utexas.edu/display/bioiteam/Using+MultiQC.
MultiQC can be used to aggregate reports from pre-alignmnet quality check as well as metrics from other downstream steps of high throughput sequencing analysis. See https://multiqc.info/docs/ for the tools that MultiQC can generate aggregate reports for.
Below, we will take a look at the MultiQC documentation to see how to run it.
multiqc --help
MultiQC allows users to input some options but mainly to run this application, we need to specify the directory that contains our analysis logs.
/// MultiQC 🔍 | v1.13.dev0
Usage: multiqc [OPTIONS] [ANALYSIS DIRECTORY]
MultiQC aggregates results from bioinformatics analyses across many samples into a single report.
It searches a given directory for analysis logs and compiles a HTML report. It's a general use tool, perfect for summarising the output from numerous
bioinformatics tools.
To run, supply with one or more directory to scan for analysis results. For
example, to run in the current working directory, use 'multiqc .'
While we can specify the path of our hbr_uhr directory to MultiQC, we are in it already so if we want to aggregate the FASTQC reports in this folder we can just specify the directory path with "." to tell MultiQC to look for files to aggregate here (in the present working directory). We use the --filname option to specify a name (multiqc_hbr_uhr) for the MultiQC report.
multiqc --filename multiqc_report_hbr_uhr .
/// MultiQC 🔍 | v1.13

|           multiqc | Search path : /home/joe/biostar_class/hbr_uhr/QC
|         searching | ━━━━━━━━━━━━━━━━━━━━━━━━━━━━━━━━━━━━━━━━ 100% 36/36
|            fastqc | Found 12 reports
|           multiqc | Compressing plot data
|           multiqc | Report      : multiqc_report.html
|           multiqc | Data        : multiqc_data
|           multiqc | MultiQC complete
After running MultiQC, we can use ls to list the contents of our folder. We see that we have a html file (multiqc_report.html) that we can open to view the quality assessment summary for all of our samples.
ls
HBR_1_R1_fastqc.html  HBR_2_R1_fastqc.html  HBR_3_R1_fastqc.html  HISTORY.fitzgepe      UHR_1_R2_fastqc.zip   UHR_2_R2_fastqc.zip   UHR_3_R2_fastqc.zip
HBR_1_R1_fastqc.zip   HBR_2_R1_fastqc.zip   HBR_3_R1_fastqc.zip   UHR_1_R1_fastqc.html  UHR_2_R1_fastqc.html  UHR_3_R1_fastqc.html  multiqc_report_hbr_uhr.html
HBR_1_R2_fastqc.html  HBR_2_R2_fastqc.html  HBR_3_R2_fastqc.html  UHR_1_R1_fastqc.zip   UHR_2_R1_fastqc.zip   UHR_3_R1_fastqc.zip   multiqc_report_hbr_uhr_data
HBR_1_R2_fastqc.zip   HBR_2_R2_fastqc.zip   HBR_3_R2_fastqc.zip   UHR_1_R2_fastqc.html  UHR_2_R2_fastqc.html  UHR_3_R2_fastqc.html
Let's copy multiqc_report.html to our public directory so we can take a look at the contents of this report in our web browser.
cp multiqc_report_hbr_uhr.html ~/public/multiqc_report_hbr_uhr.html
Upon opening the MultiQC report, we see a navigation panel (similar to what we have with the individual FASTQC reports) that allows us to quickly move to different sections of the report. We are also provided with links to get help if we have questions about how to use the MultiQC reports. To the right of the report page, we have a tool box that allows us to do things like highlighting different samples in different colors for better visualization, rename samples, and export each of the individual QC plots as an image for inclusion in presentations and/or publications. MultiQC reports are interactive.
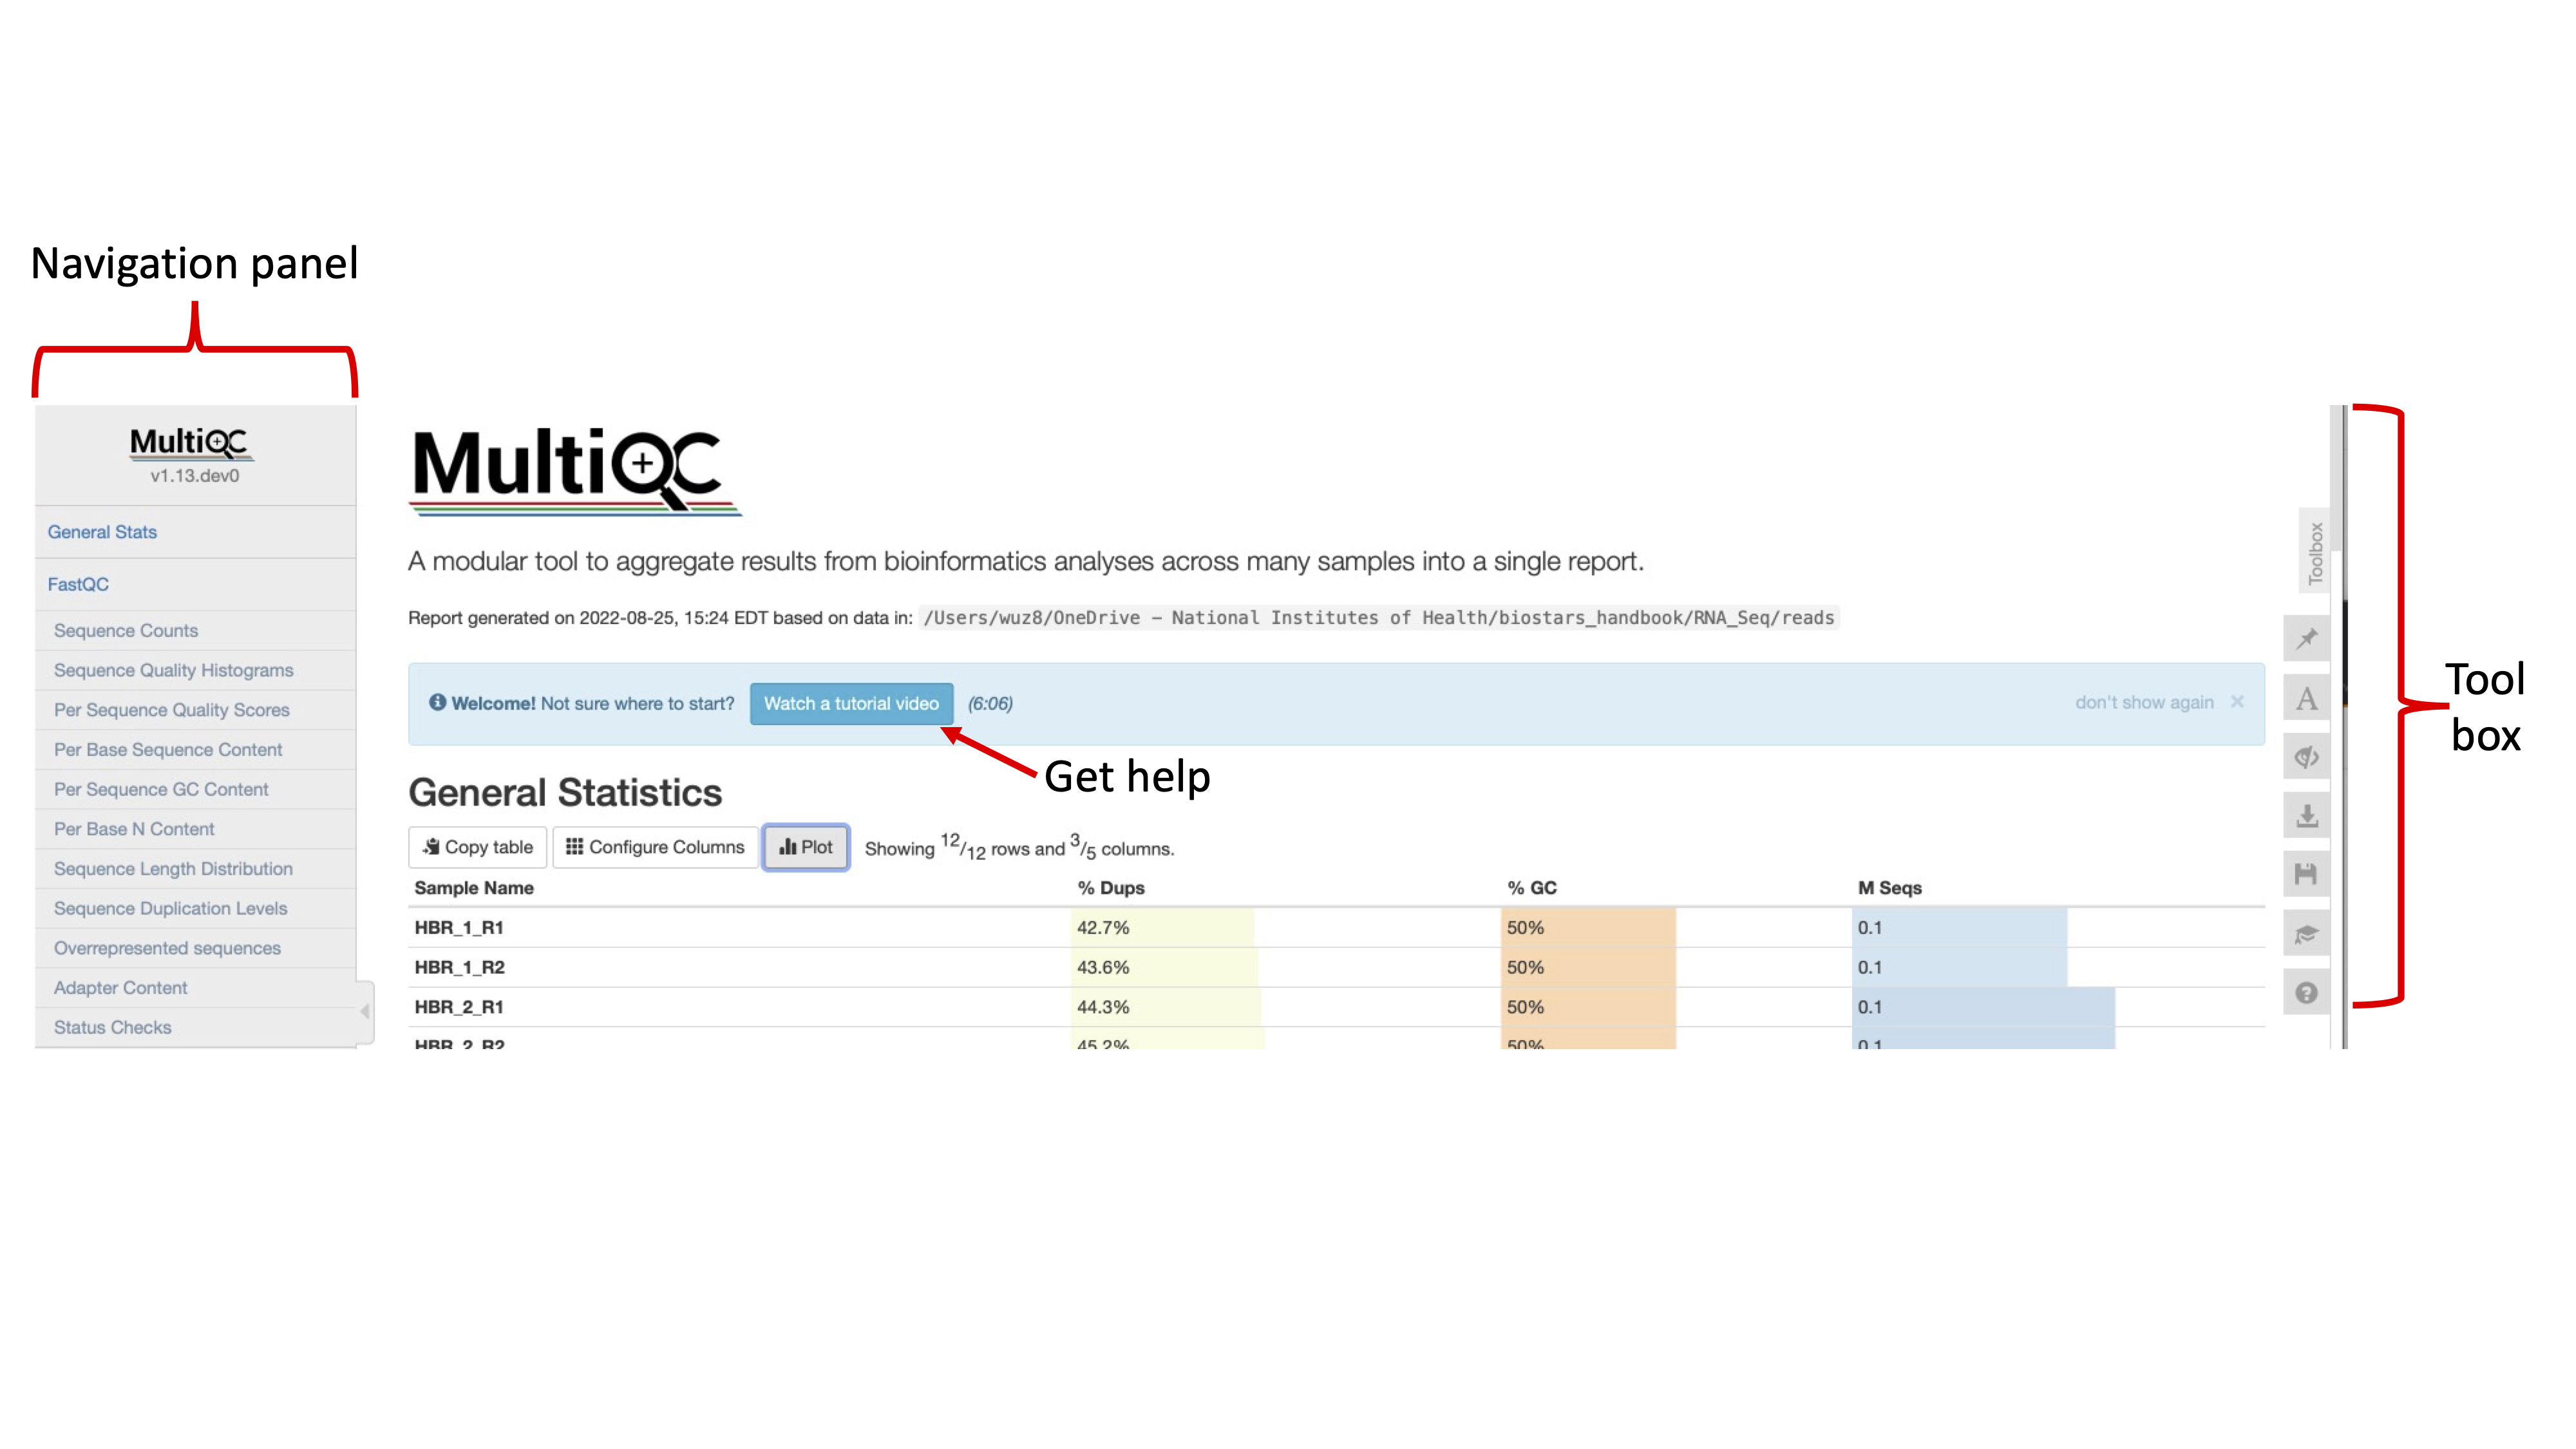
Figure 1
The next figure (Figure 2) shows some basic statistics about our samples, including percentage of duplicate reads, GC content, number of bases in the sequencing reads (or read length), percentage of modules that failed in the FASTQC report for that sample, and the total number of sequences in a FASTQ file (in Millions of sequences).
We can click on the Configure Columns tab to choose which columns we like to see in this table (Figure 3) and the plot button to visualize the data in graphical format.
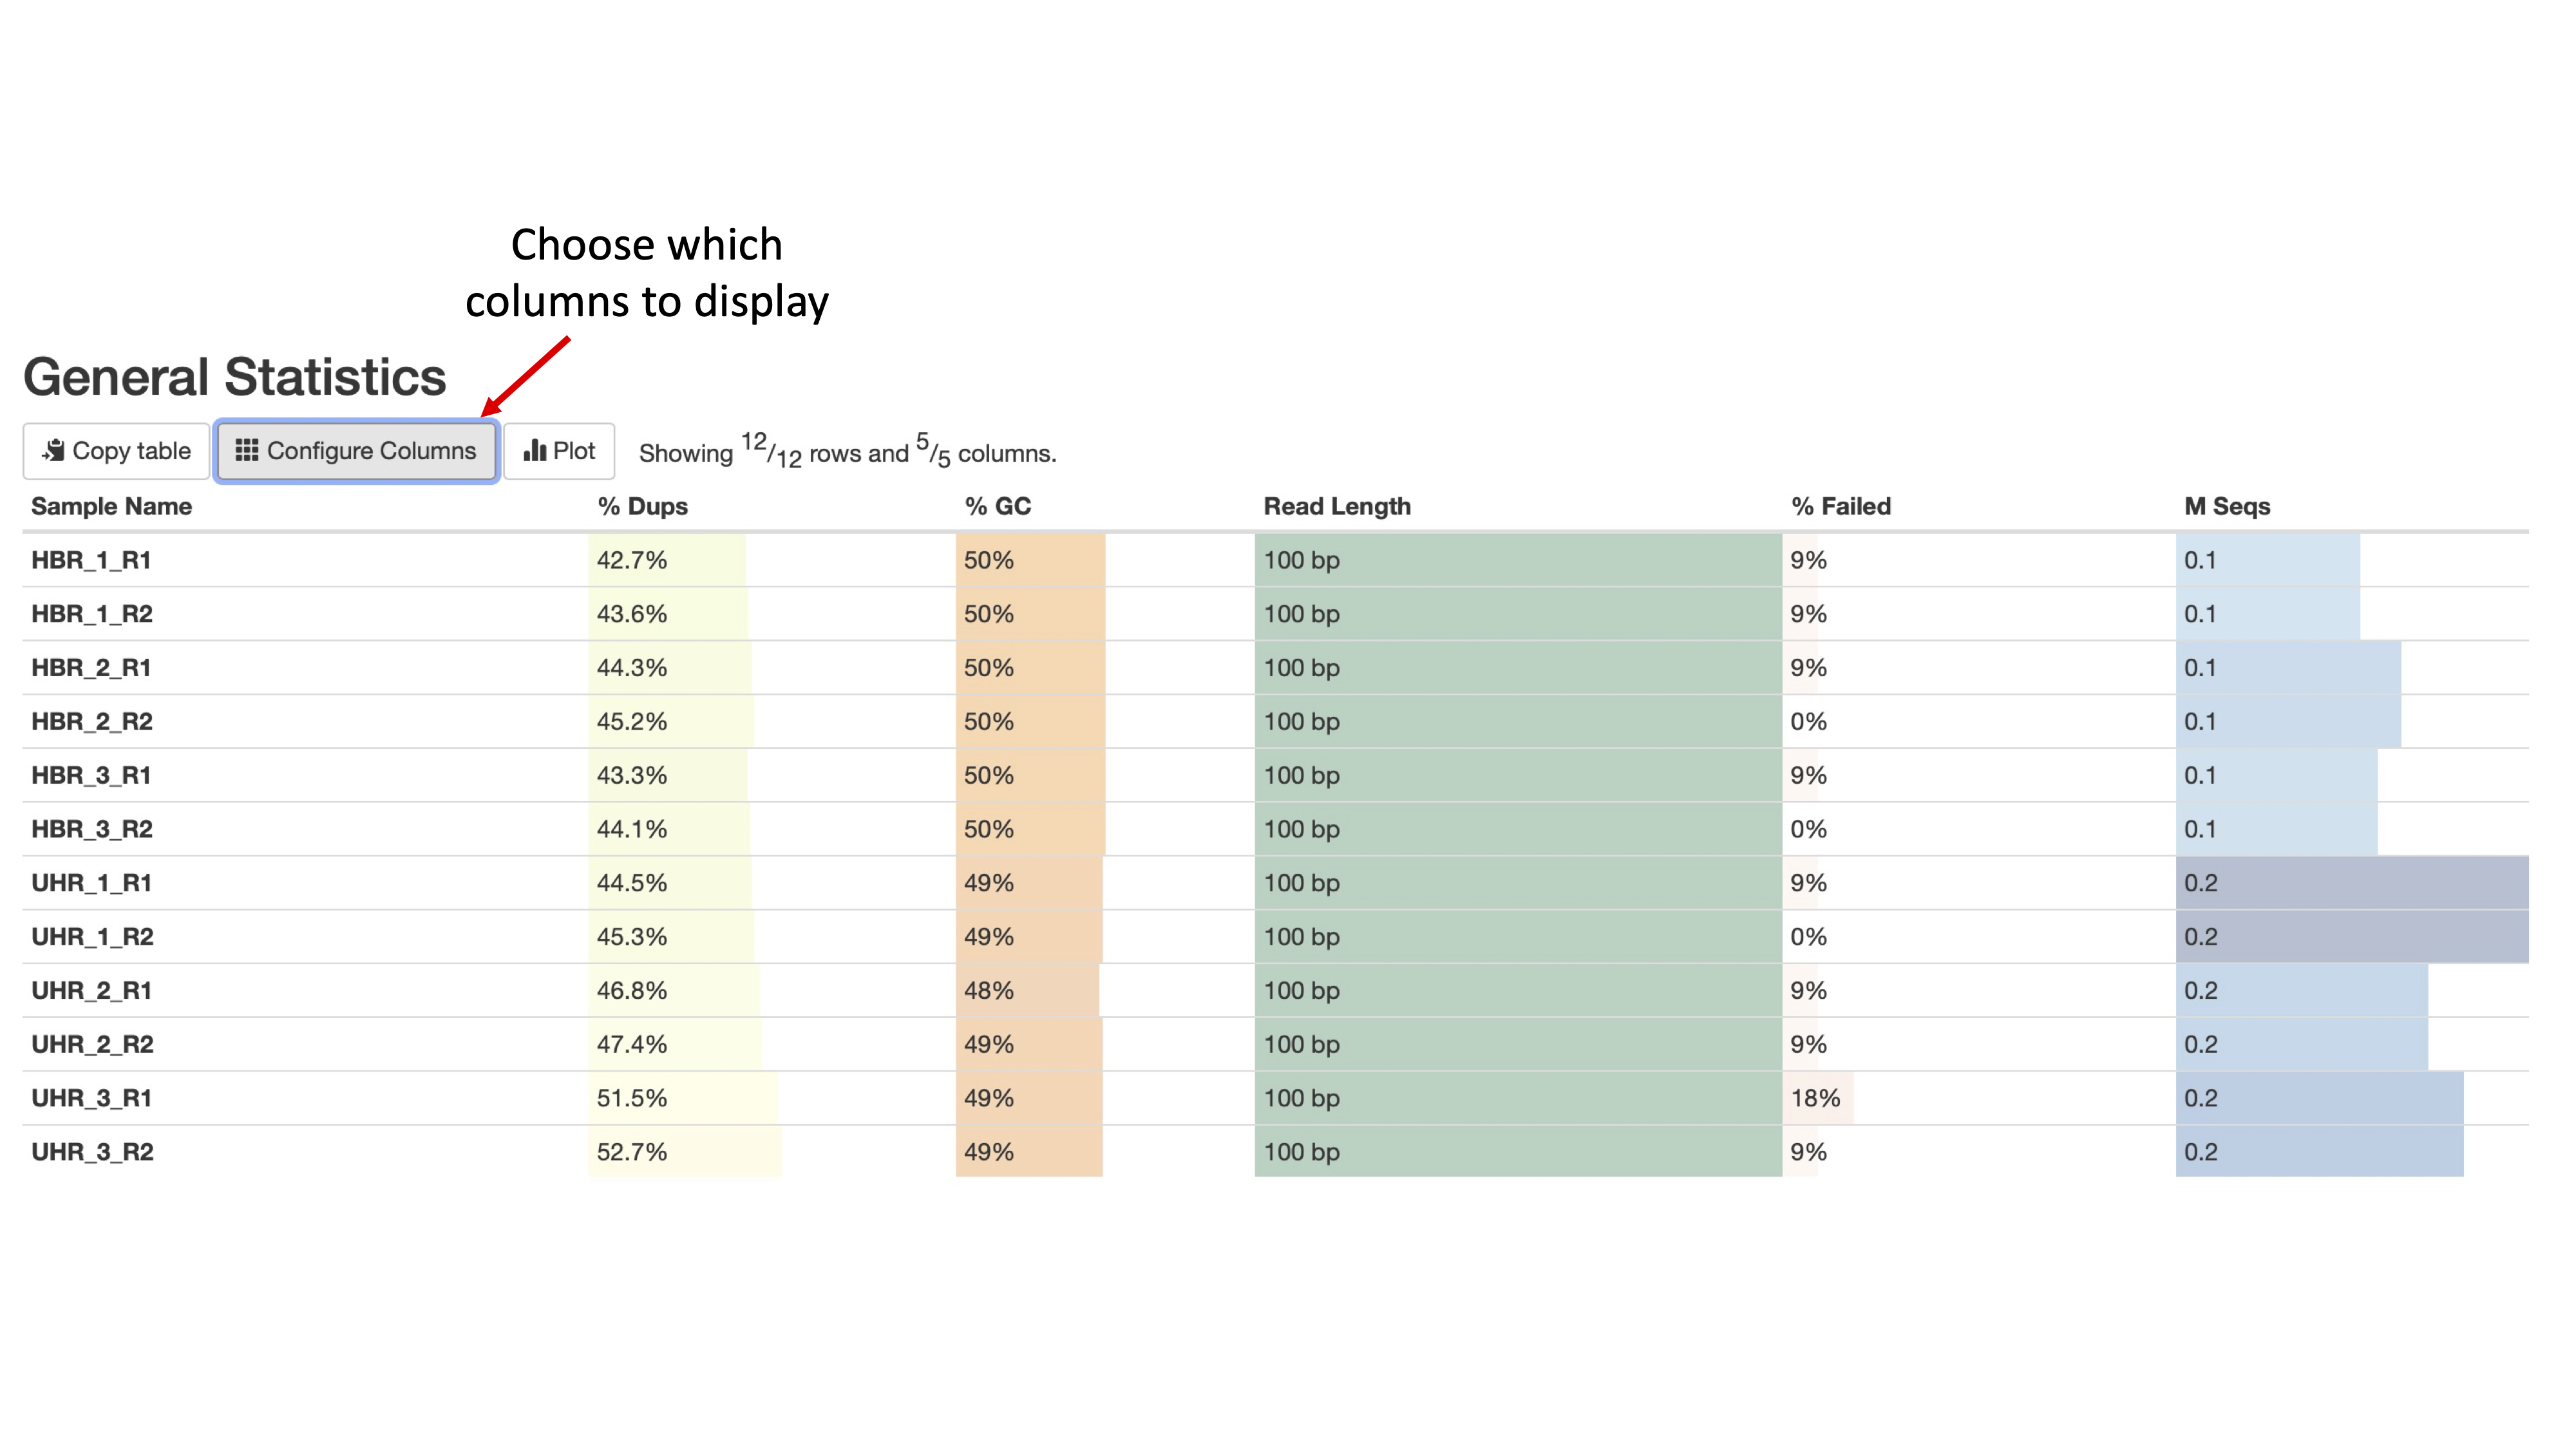
Figure 2
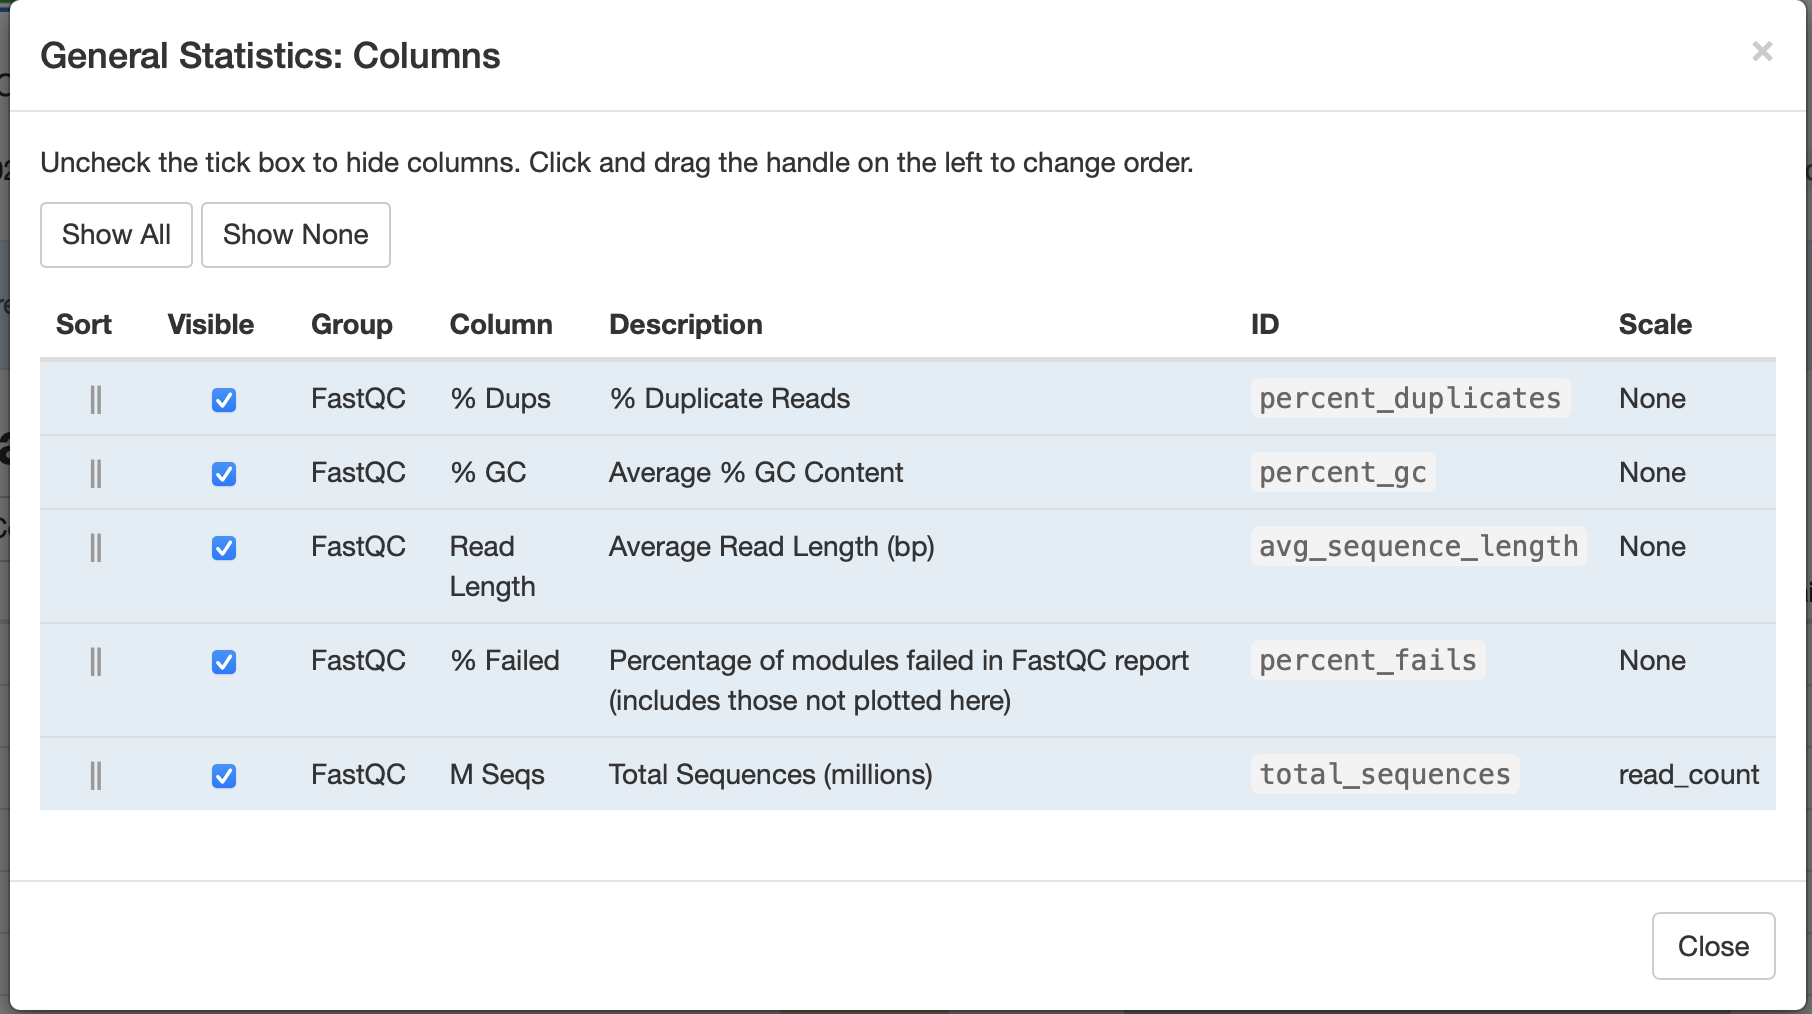
Figure 3
The next plot (Figure 4) shows the break down of unique and duplicate reads for each FASTQ file. Again, duplication suggests some sort of enrichment bias. The default to this panel is to show the number of sequences but we can get a percentage breakdown by clicking on the Percentages tab.
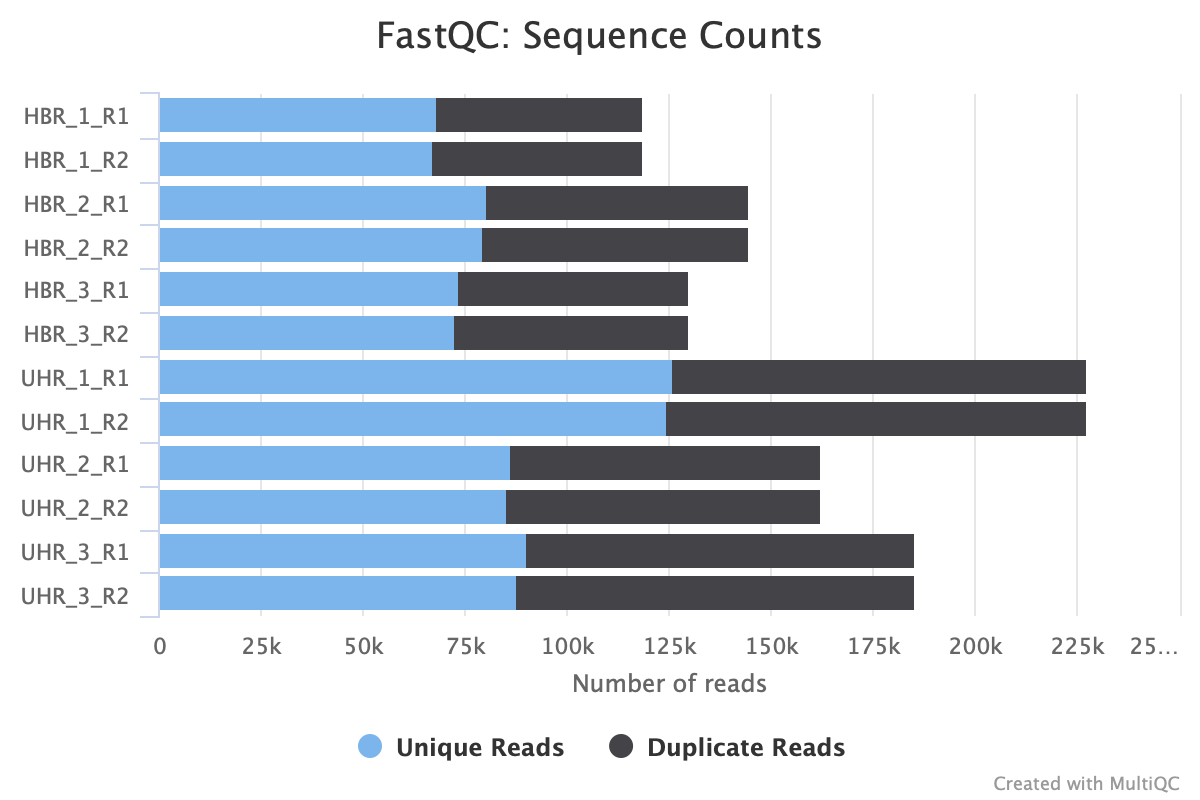
Figure 4
Figure 5 shows us the average quality score of the sequencing reads in FASTQ files along each base position. If we click on the green rectangle with the number 12 written in it, we can choose which sample we like to see in our plot (Figure 6). Regarding these boxes at the top of the QC plots, green means QC passed while orange and red indicate warning and failed, respectively.
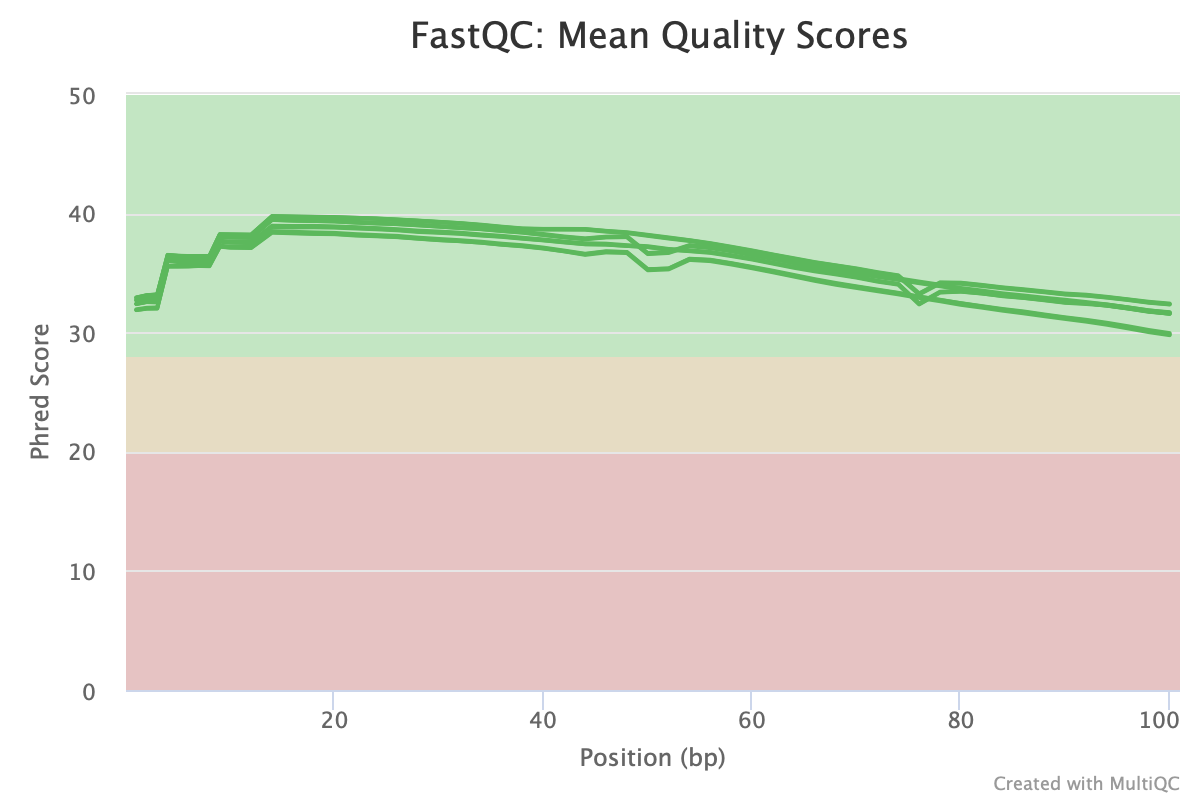
Figure 5

Figure 6
In Figure 7, we see the quality score distribution of each of our FASTQ files.

Figure 7
In Figure 8, we get an interactive heatmap of the percent composition of each nucleotide base (A,T,C,G) along the bases (horizontal axis) for each of the FASTQ files (vertical axis). If we hover over a tile, we will see the corresponding numbers. If we click on any row in this heatmap, we will get the base composition plot for just that sample (Figure 9).
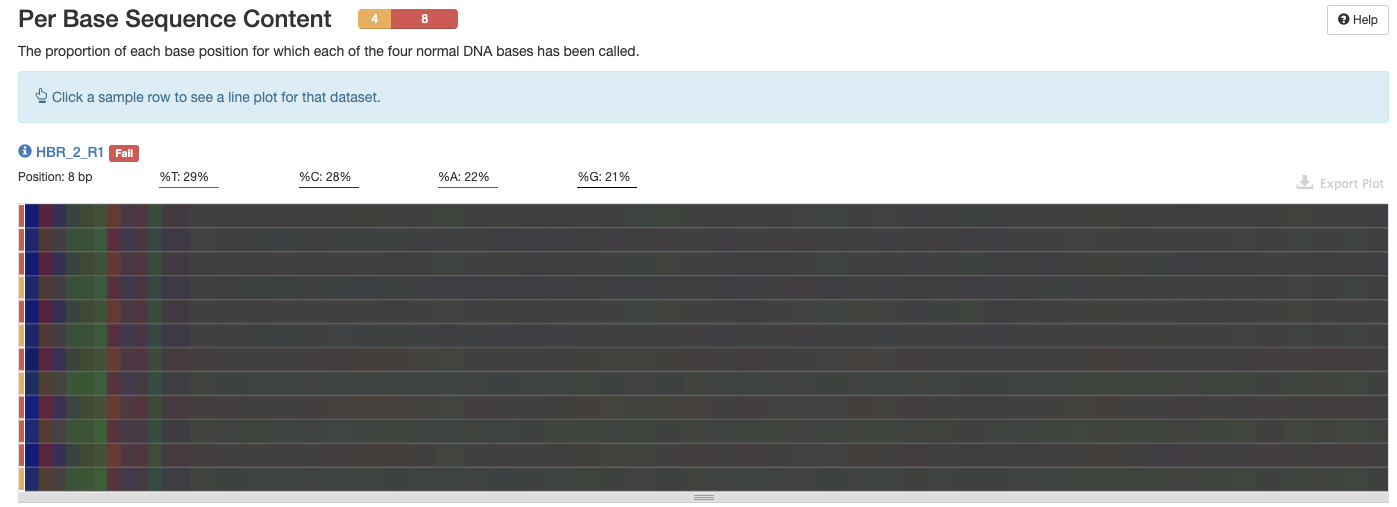
Figure 8

Figure 9
The GC distribution for each of the FASTQ files is shown in Figure 10.

Figure 10
Figure 11 tells us that except for a few bases at the beginning of the read, we do not have unknown bases in our FASTQ files.

Figure 11
Figure 12 tells us that all of the reads in our FASTQ files have 100 bases, so no problems there.

Figure 12
We see the sequence duplication levels, overrepresented sequences, and adapter content information in Figures 13 through 15.
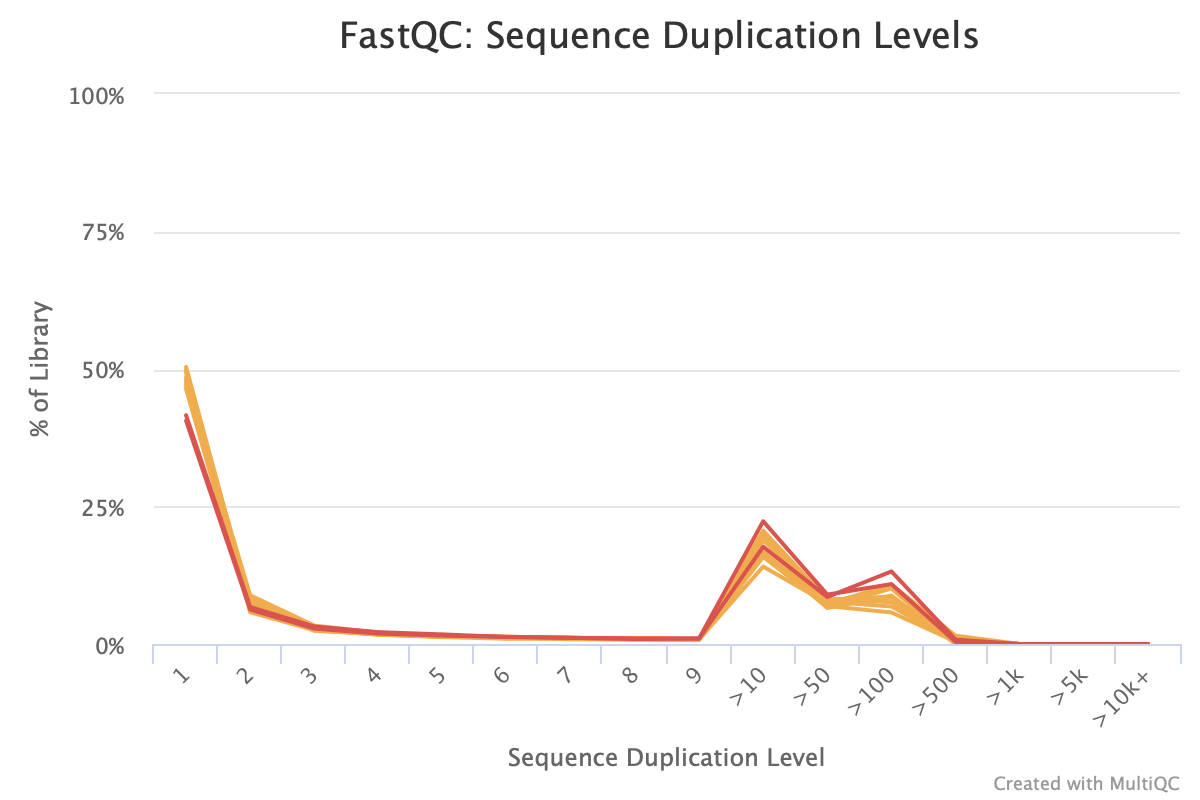
Figure 13
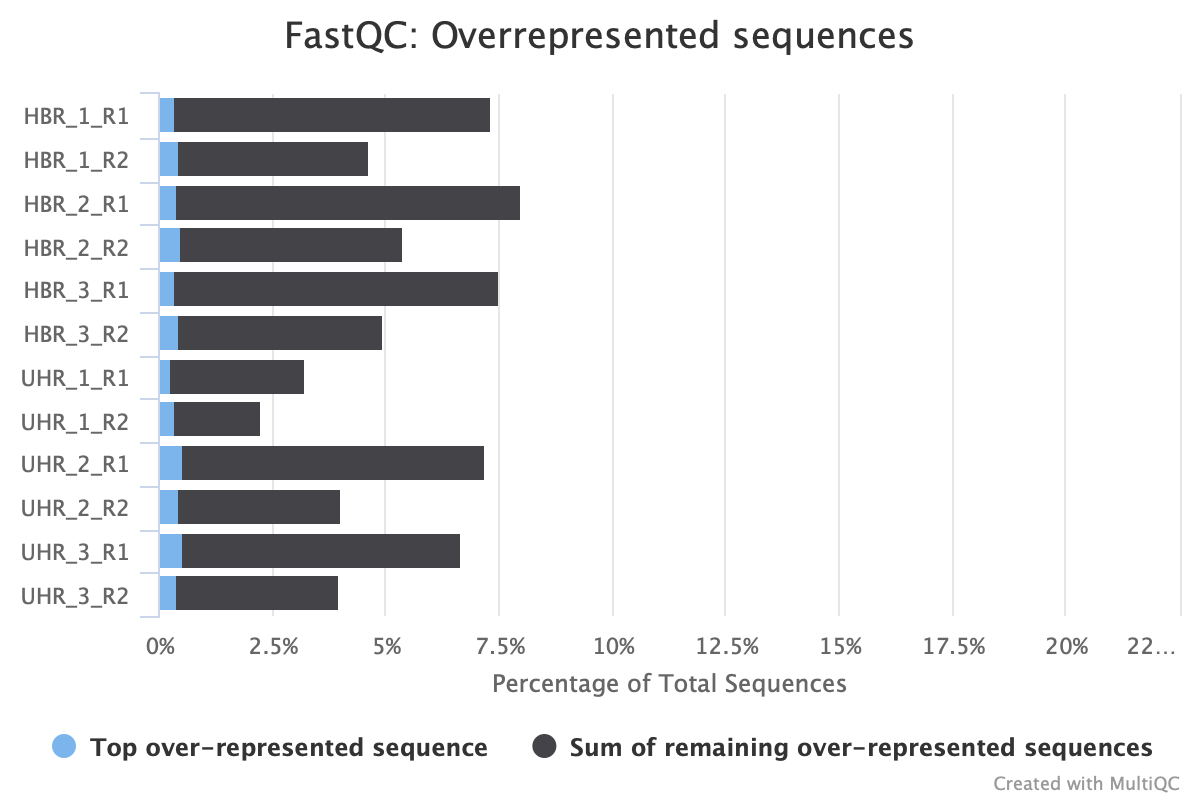
Figure 14

Figure 15
At the end of the MultiQC report, we see a heatmap of the modules that have passed, warn, or failed status for each of the FASTQ files.
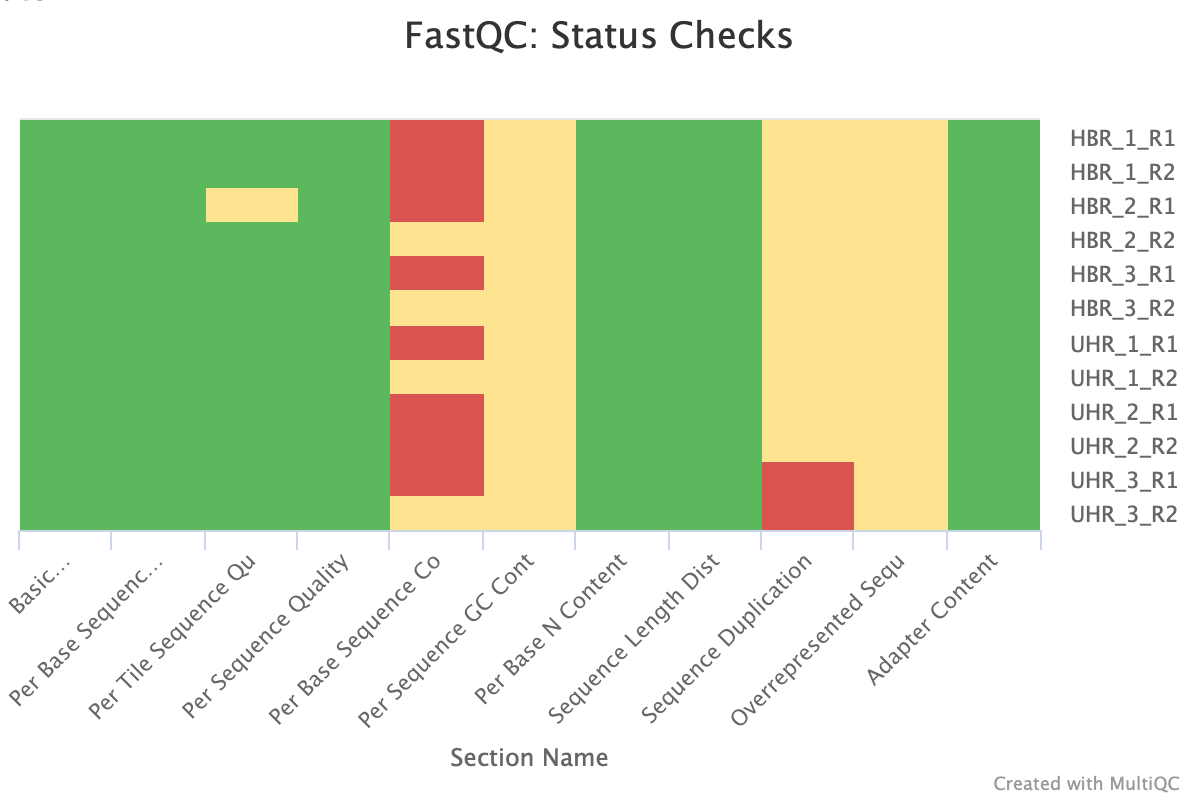
Figure 16
Trimming away adapters and poor quality reads
We will be downloading a FASTQ file from the Sequence Read Archive to learn about trimming. But first, go back to the ~/biostar_class folder and then create a new directory named trimming.
cd ~/biostar_class
mkdir trimming
cd trimming
Let's now download the FASTQ files for SRR1553606, which was sequenced under the paired end format, so we will need to specify --split-file to separate read 1 and read 2. We specify -X 10000 to retrieve only 10000 reads, otherwise the download will take longer.
fastq-dump --split-files -X 10000 SRR1553606
shows this output
Read 10000 spots for SRR1553606
Written 10000 spots for SRR1553606
ls
SRR1553606_1.fastq SRR1553606_2.fastq
Let's run FASTQC for both read 1 and read 2 of SRR1553606. We can use the wildcard (*) to get both files rather than inputting them separately.
fastqc SRR1553606_*.fastq
We can copy the FASTQC reports for SRR1553606 to the ~/public directory to review them.
cp SRR1553606_1_fastqc.html ~/public
cp SRR1553606_2_fastqc.html ~/public
Initial QC of both FASTQ files for SRR1553606 shows failures and warnings. Figures 17 through 20 shows the per base sequence quality and adapter content for SRR1553606 read 1 and read 2. Here let's focus on removing adapters and poor quality reads. Adapters in particular will interfere with the alignment step. At the end of the reads in SRR1553606_2, we see that the 25th - 75th percentile (the yellow box) of scores span a large range, with many of them in the orange and red regions, where reliability of the reads would come into question (Figure 20).
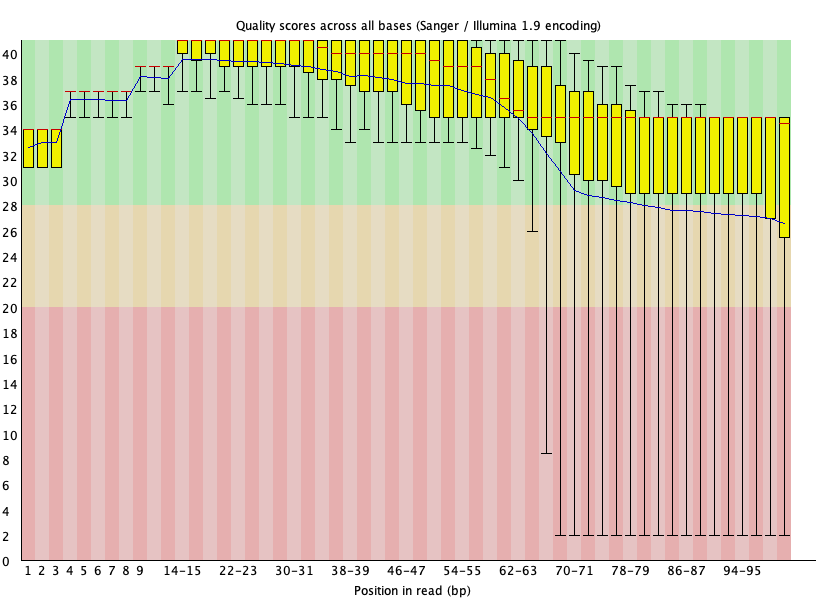
Figure 17: Per base quality for SRR1553606_1.fastq
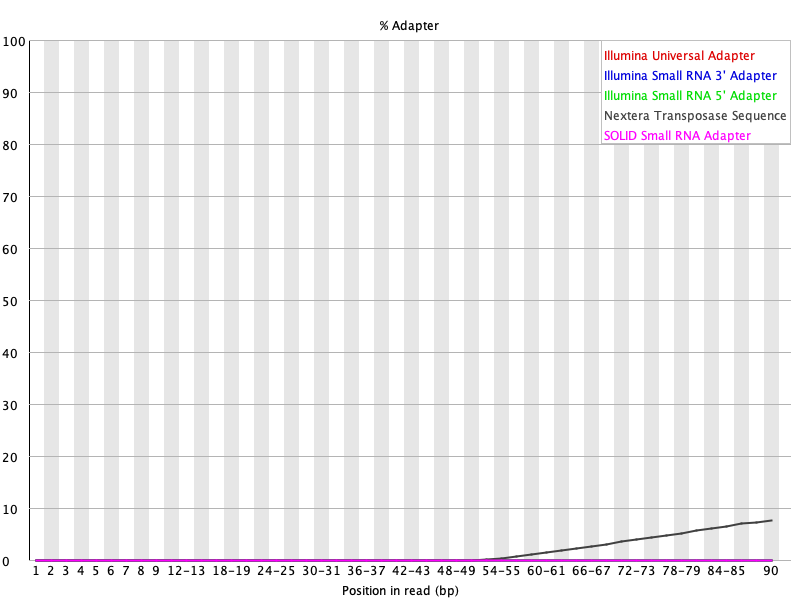
Figure 18: Adapter content for SRR1553606_1.fastq

Figure 19: Per base quality for SRR1553606_2.fastq

Figure 20: Adapter content for SRR1553606_2.fastq
Trimming with Trimmomatic
Let's use the tool Trimmomatic to clean up the adapters and the poor quality reads for SRR1553606. For help with Trimmomatic type trimmomatic --help at the command line.
Before getting started with using trimmomatic, let's create a file called nextera.fa which houses the nextera adapter sequence that we need to remove (from the FASTQC result, we have Nextera adapter contamination).
The command below will create a file called nextera.fa and open it in the nano editor. We can then copy and paste the sequence, then hit control-x to save and exit the editor.
nano nextera.fa
>nextera
CTGTCTCTTATACACATCTCCGAGCCCACGAGAC
We initiate the application by typing trimmomatic at the command line and the parameters are explained below.
- PE stands for paired end mode. We are dealing with sequencing data derived from paired end library preparation so we can use this option. If we have single end sequencing data then we can replace PE with SE. After specifying paired end (PE) mode
- The files for read 1 and read 2 are entered
- Following that, we enter the names of the trimmed FASTQ files (SRR1553606_trimmed_1.fastq and SRR1553606_trimmed_2.fastq). We need to specify two because we have two input files for paired end sequencing
- Note that we also specify a file name for unpaired reads (SRR1553606_trimmed_1_unpaired.fastq and SRR1553606_trimmed_2_unpaired.fastq). Sometimes a read in one file may be successfully processed while the same read will not be successfully processed in the second file, thus, we place these reads in a separate file.
- The next portion to the trimmomatic command allows us to specify the quality score criteria for trimming. Here we use a sliding window (SLIDINGWINDOW), which scans the 5' end of the read and removes when the average quality of the window falls below a threshold.
- We choose a window size of 4 reads
- Quality threshold of 30
- The final construction is SLIDINGWINDOW:4:30
- We then use the ILLUMINACLIP flag to specify the file to our adapter sequence where the numbers (2:30:5) that follows sets the criteria on how Trimmomatic would determine whether a portion of the read matches the adapter (see the Trimmomatic manual at http://www.usadellab.org/cms/uploads/supplementary/Trimmomatic/TrimmomaticManual_V0.32.pdf for more).
- In the MINLEN argument, we specify 50 and Trimmomatic will remove reads that are less than 50 bases. We set this threshold because shorter reads will be difficult to map because they would potentially fall onto multiple regions of the genome.
trimmomatic PE SRR1553606_1.fastq SRR1553606_2.fastq SRR1553606_trimmed_1.fastq SRR1553606_trimmed_1_unpaired.fastq SRR1553606_trimmed_2.fastq SRR1553606_trimmed_2_unpaired.fastq SLIDINGWINDOW:4:30 ILLUMINACLIP:nextera.fa:2:30:5 MINLEN:50
Trimmomatic will display the following as it runs.
TrimmomaticPE: Started with arguments:
 SRR1553606_1.fastq SRR1553606_2.fastq SRR1553606_trimmed_1.fastq SRR1553606_trimmed_1_unpaired.fastq SRR1553606_trimmed_2.fastq SRR1553606_trimmed_2_unpaired.fastq SLIDINGWINDOW:4:30 ILLUMINACLIP:nextera_adapter.fa:2:30:5 MINLEN:50
Using Long Clipping Sequence: 'CTGTCTCTTATACACATCTCCGAGCCCACGAGAC'
ILLUMINACLIP: Using 0 prefix pairs, 1 forward/reverse sequences, 0 forward only sequences, 0 reverse only sequences
Quality encoding detected as phred33
Input Read Pairs: 10000 Both Surviving: 6301 (63.01%) Forward Only Surviving: 766 (7.66%) Reverse Only Surviving: 303 (3.03%) Dropped: 2630 (26.30%)
TrimmomaticPE: Completed successfully
In the ls command below, we place * (wildcard) around trimmed to tell ls that we want any file with the word trimmed in it. We use * before and after so that ls will know there could be characters before trimmed and also after.
ls *trimmed*
SRR1553606_trimmed_1.fastq
SRR1553606_trimmed_1_unpaired.fastq
SRR1553606_trimmed_2.fastq
SRR1553606_trimmed_2_unpaired.fastq
Run FASTQC on the trimmed FASTQ files.
fastqc SRR1553606_trimmed_1.fastq SRR1553606_trimmed_2.fastq
Copy FASTQC reports for the SRR1553606 trimmed data to the ~/public folder to view.
cp SRR1553606_trimmed_1_fastqc.html ~/public
cp SRR1553606_trimmed_2_fastqc.html ~/public
Our per base quality looks much better and adapters were removed after trimming using Trimmomatic. Note in the basic statistics portion of the FASTQC report for the trimmed files, we loss around 40% of the reads from original. Therefore, trimming is a balancing act between removing unwanted reads and keeping as much of the original information as possible to prevent our experiment from becoming a wasted effort.
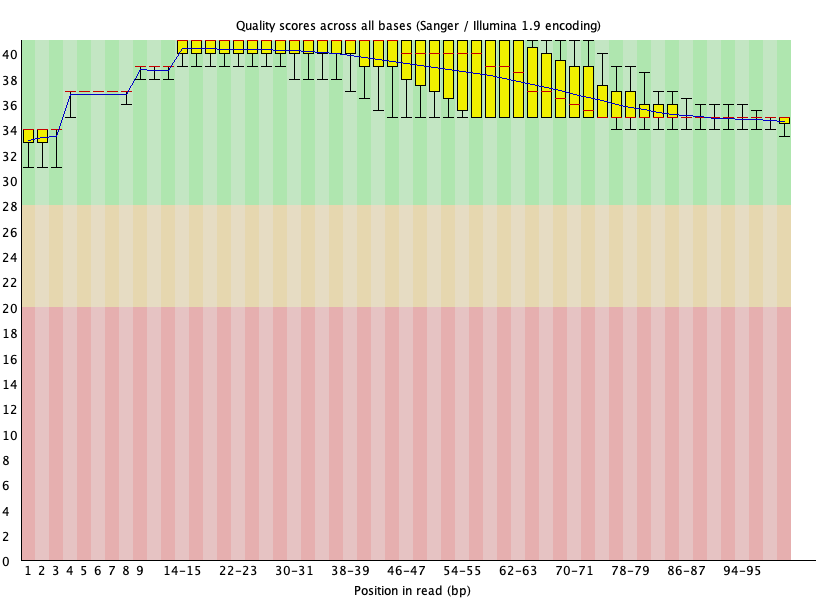
Figure 21: Per base quality for SRR1553606_1 after Trimmomatic trimming.
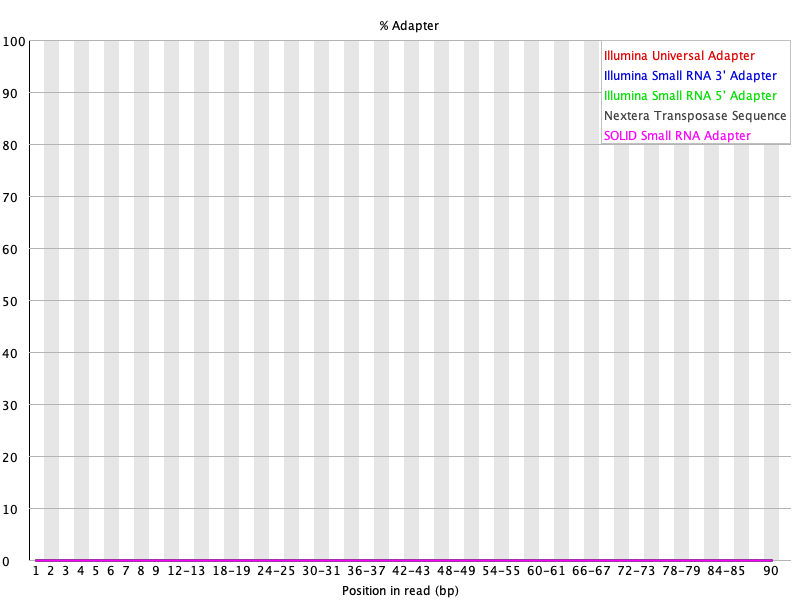
Figure 22: Adapter content for SRR1553606_1 after Trimmomatic trimming.
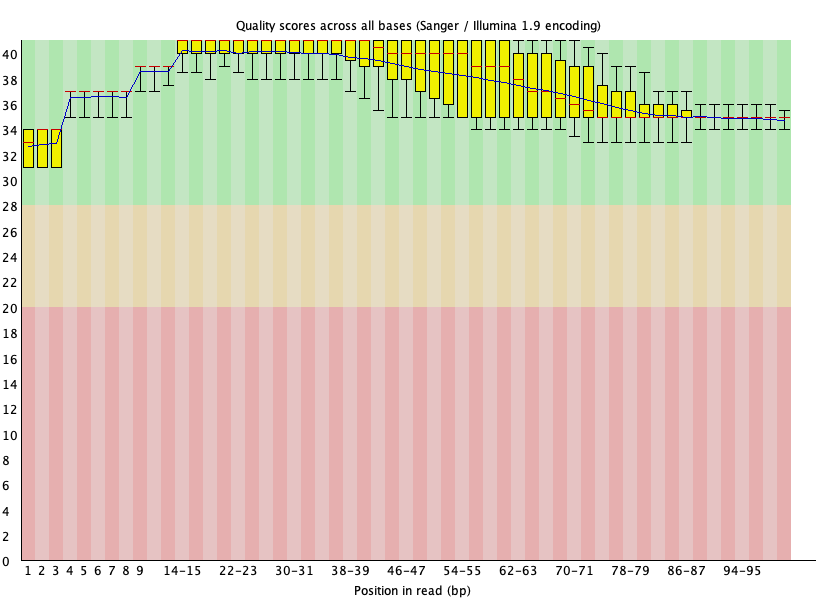
Figure 23: Per base quality for SRR1553606_2 after Trimmomatic trimming.
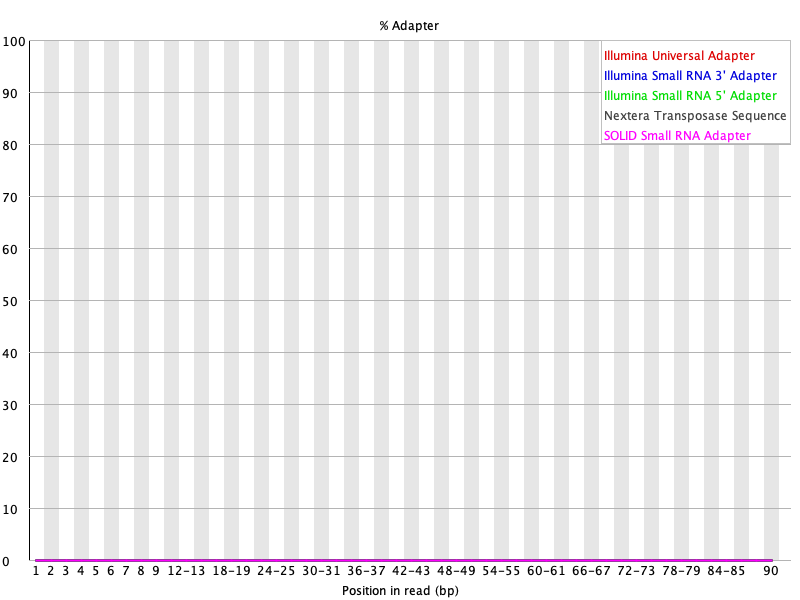
Figure 24: Adapter content for SRR1553606_2 after Trimmomatic trimming.
Trimming with BBDuk
BBDuk is another tool that can be used for adapter and quality trimming. In addition, BBDuk can be used to filter out contaminations, perform GC filtering, filter for length, etc. (see https://jgi.doe.gov/data-and-tools/software-tools/bbtools/bb-tools-user-guide/bbduk-guide/).
Let's run BBDuk to do the same adapter and quality trim as we did with Trimmomatic for the FASTQ files in SRR1553606.
To initiate BBDuk we type bbduk.sh at the command prompt
- Again, we are working with paired end sequencing so we provide read 1 after the "in=" argument and then read 2 after "in2=". Similarly, we specify the output file names for read 1 and read 2 after the "out=" and "out2=" arguments, respectively.
- The qtrim argument tells BBDuk we want to perform quality trimming. Setting qtrim=r means that BBDuk will trim from the right side of the sequence. We specify the quality threshold for trimming to 30 using the trimq argument.
- For adapter trimming, we specify the adapter sequence FASTA file (again, we will be uisng nextera.fa created earlier). Note that for adapter trimming, we use the ktrim option, which essentially tells BBDuk to trim based on sequence matching rather than quality. Here, we set ktrim=r so that BBDuk will trim away bases to the right of the match. The parameters that follow ktrim are criteria that determine whether a portion of the sequencing read matches the adapter.
- See BBDuk manual for more about arguments and parameters that can be used with this program.
bbduk.sh in=SRR1553606_1.fastq in2=SRR1553606_2.fastq out=SRR1553606_bbduk_1.fastq out2=SRR1553606_bbduk_2.fastq qtrim=r trimq=30 ref=nextera.fa ktrim=r k=16 mink=10 hdist=1 tpe minlen=50
As BBDuk is running, we see statistics such as the number of reads that are quality and/or adapter trimmed. We also see the number of reads that have been removed and the number of reads that remain.
Input is being processed as paired Started output streams: 0.005 seconds. Processing time: 0.148 seconds.
Input: 20000 reads 2020000 bases. QTrimmed: 4137 reads (20.69%) 276896 bases (13.>71%) KTrimmed: 5632 reads (28.16%) 448982 bases (22.>23%) Total Removed: 6356 reads (31.78%) 725878 bases (35.>93%) Result: 13644 reads (68.22%) 1294122 bases >(64.07%)
Time: 0.172 seconds. Reads Processed: 20000 116.38k reads/sec Bases Processed: 2020k 11.75m bases/sec
Running FASTQC on the BBDuk trimmed output, we see that BBDuk performs similar to Trimmomatic.
fastqc SRR1553606_bbduk_1.fastq SRR1553606_bbduk_2.fastq
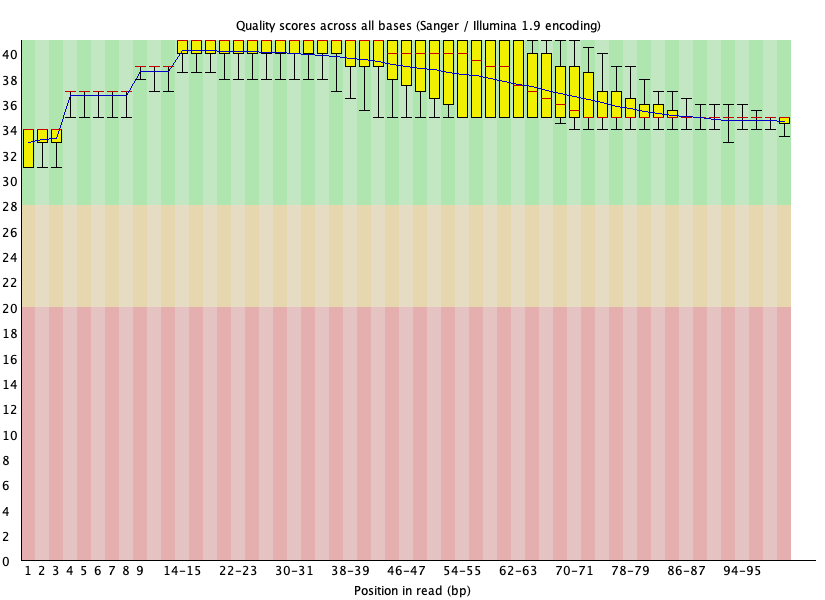
Figure 25: SRR1553606_1 per base quality after BBDuk trimming
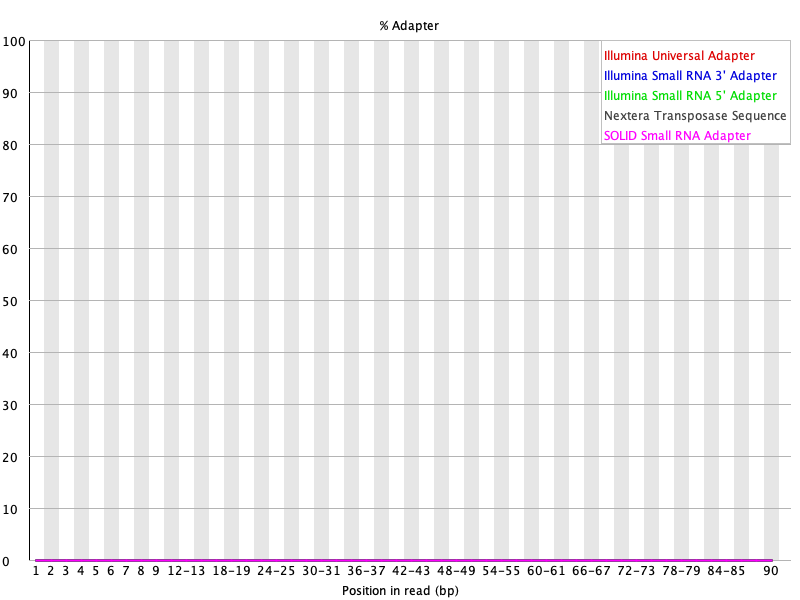
Figure 26: SRR1553606_1 adapter content after BBDuk trimming
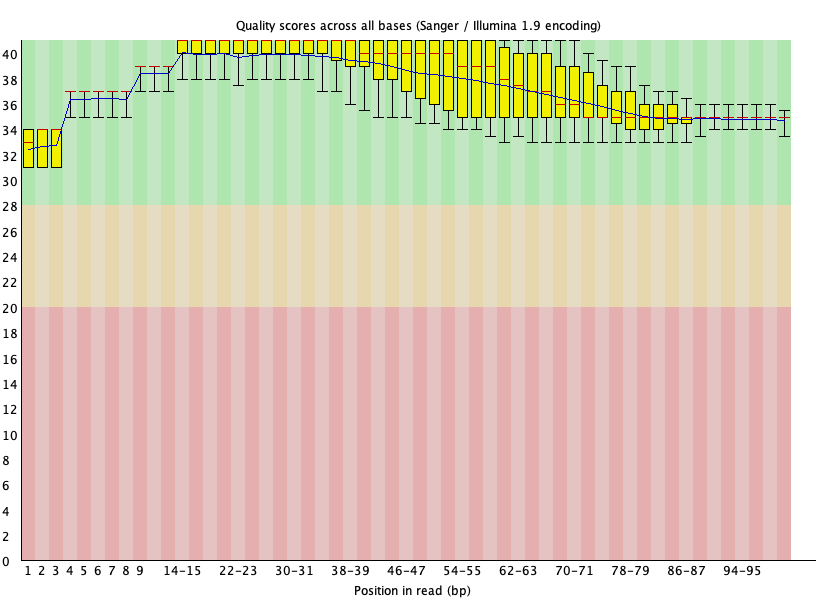
Figure 27: SRR1553606_2 per base quality after BBDuk trimming

Figure 28: SRR1553606_2 adapter content after BBDuk trimming
MultiQC report for HBR and UHR dataset
FASTQC reports for SRR1553606
SRR1553606_1.fastq not trimmed
SRR1553606_2.fastq not trimmed
SRR1553606_1.fastq trimmed with Trimmomatic
SRR1553606_2.fastq trimmed with Trimmomatic
SRR1553606_1.fastq trimmed with BBDuk
SRR1553606_2.fastq trimmed with BBDuk
SRR1553606 MultiQC report - aggregate of untrimmed, Trimmomatic trimmed, and BBDuk trimmed results