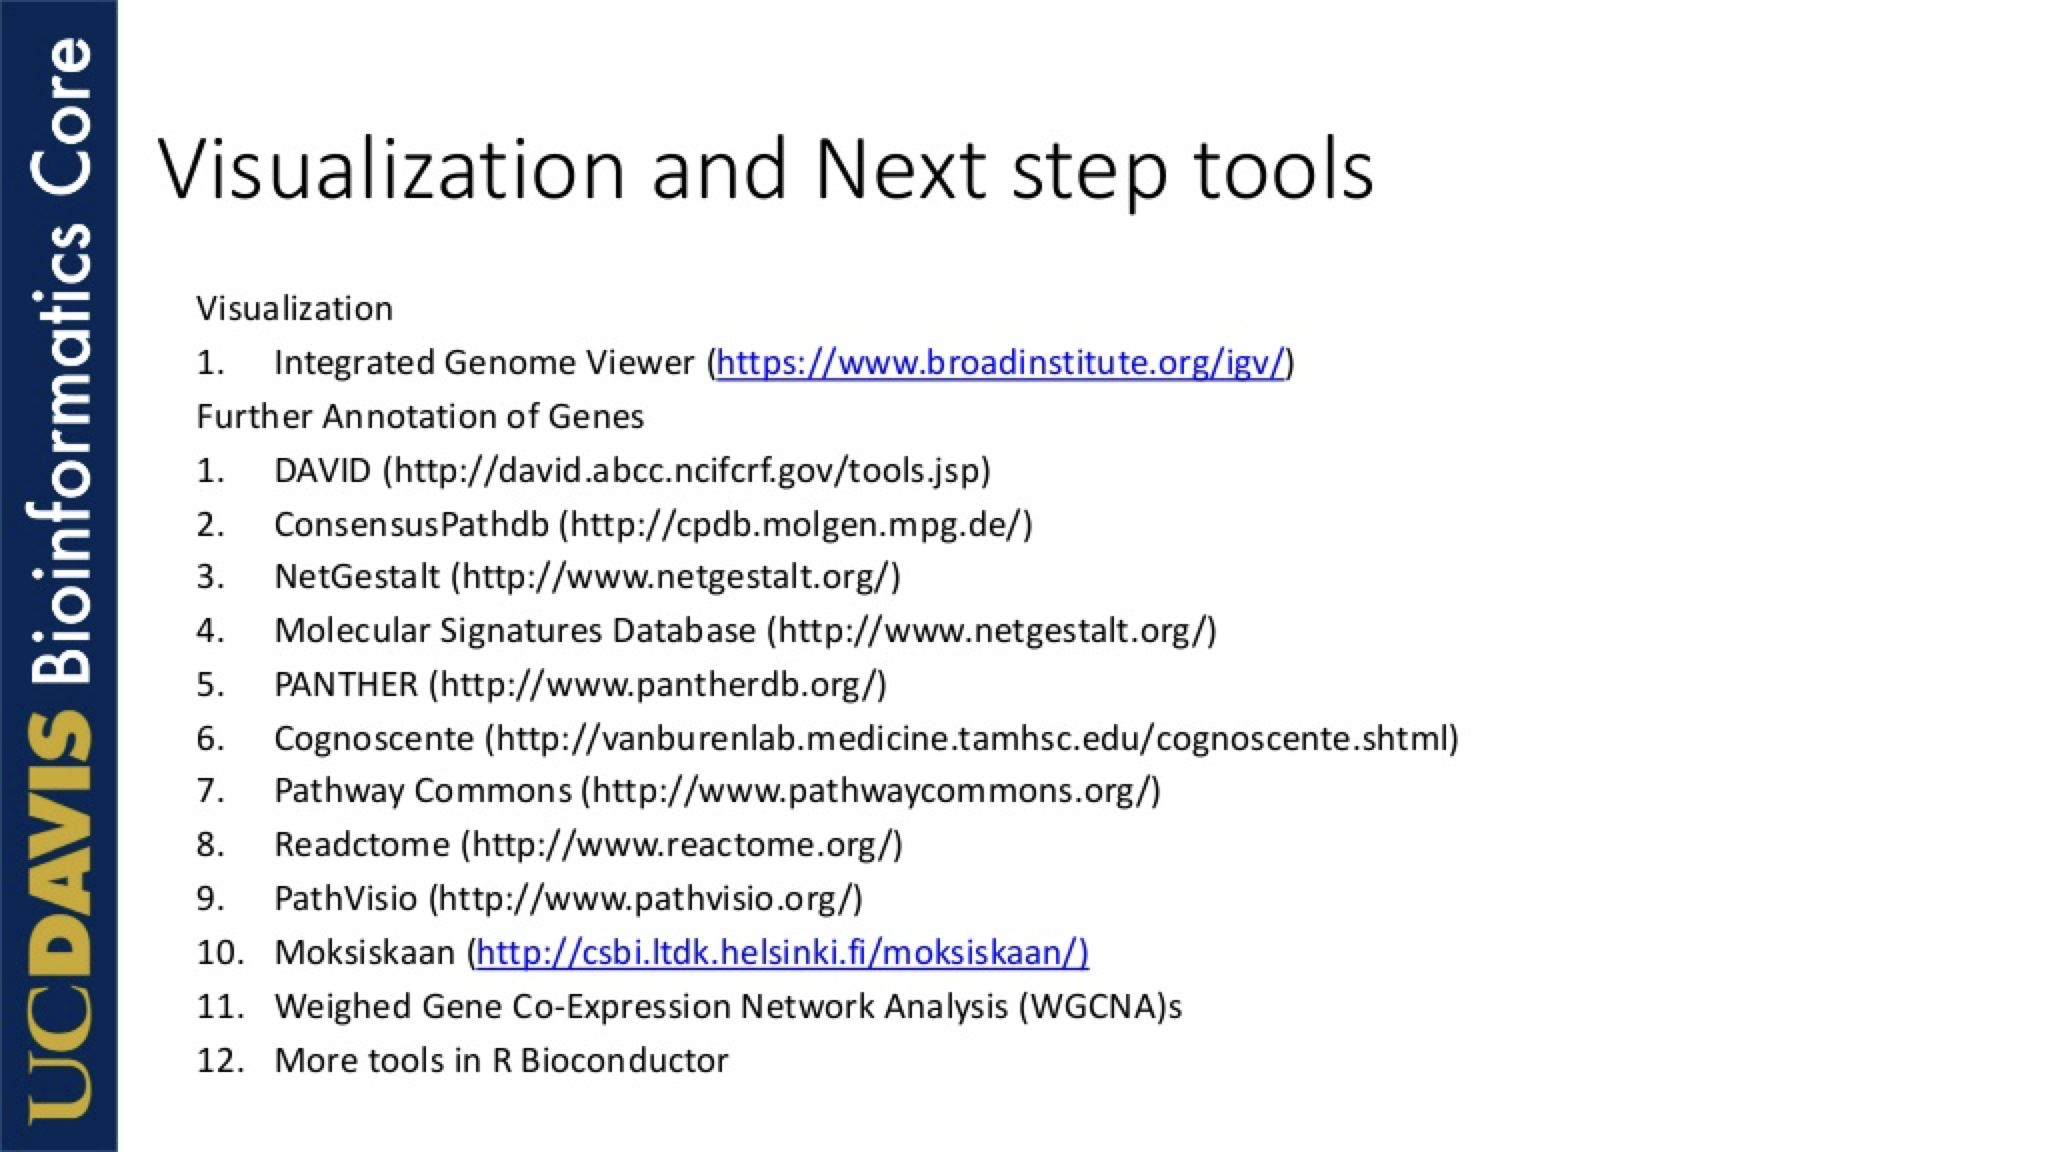
Visualization Here are a number of visual elements that are typically produce from RNASEQ data. Normalization plots PCA and Volcano plots Scatter plot and correlation coefficients Heat Maps IGV Traces Resources
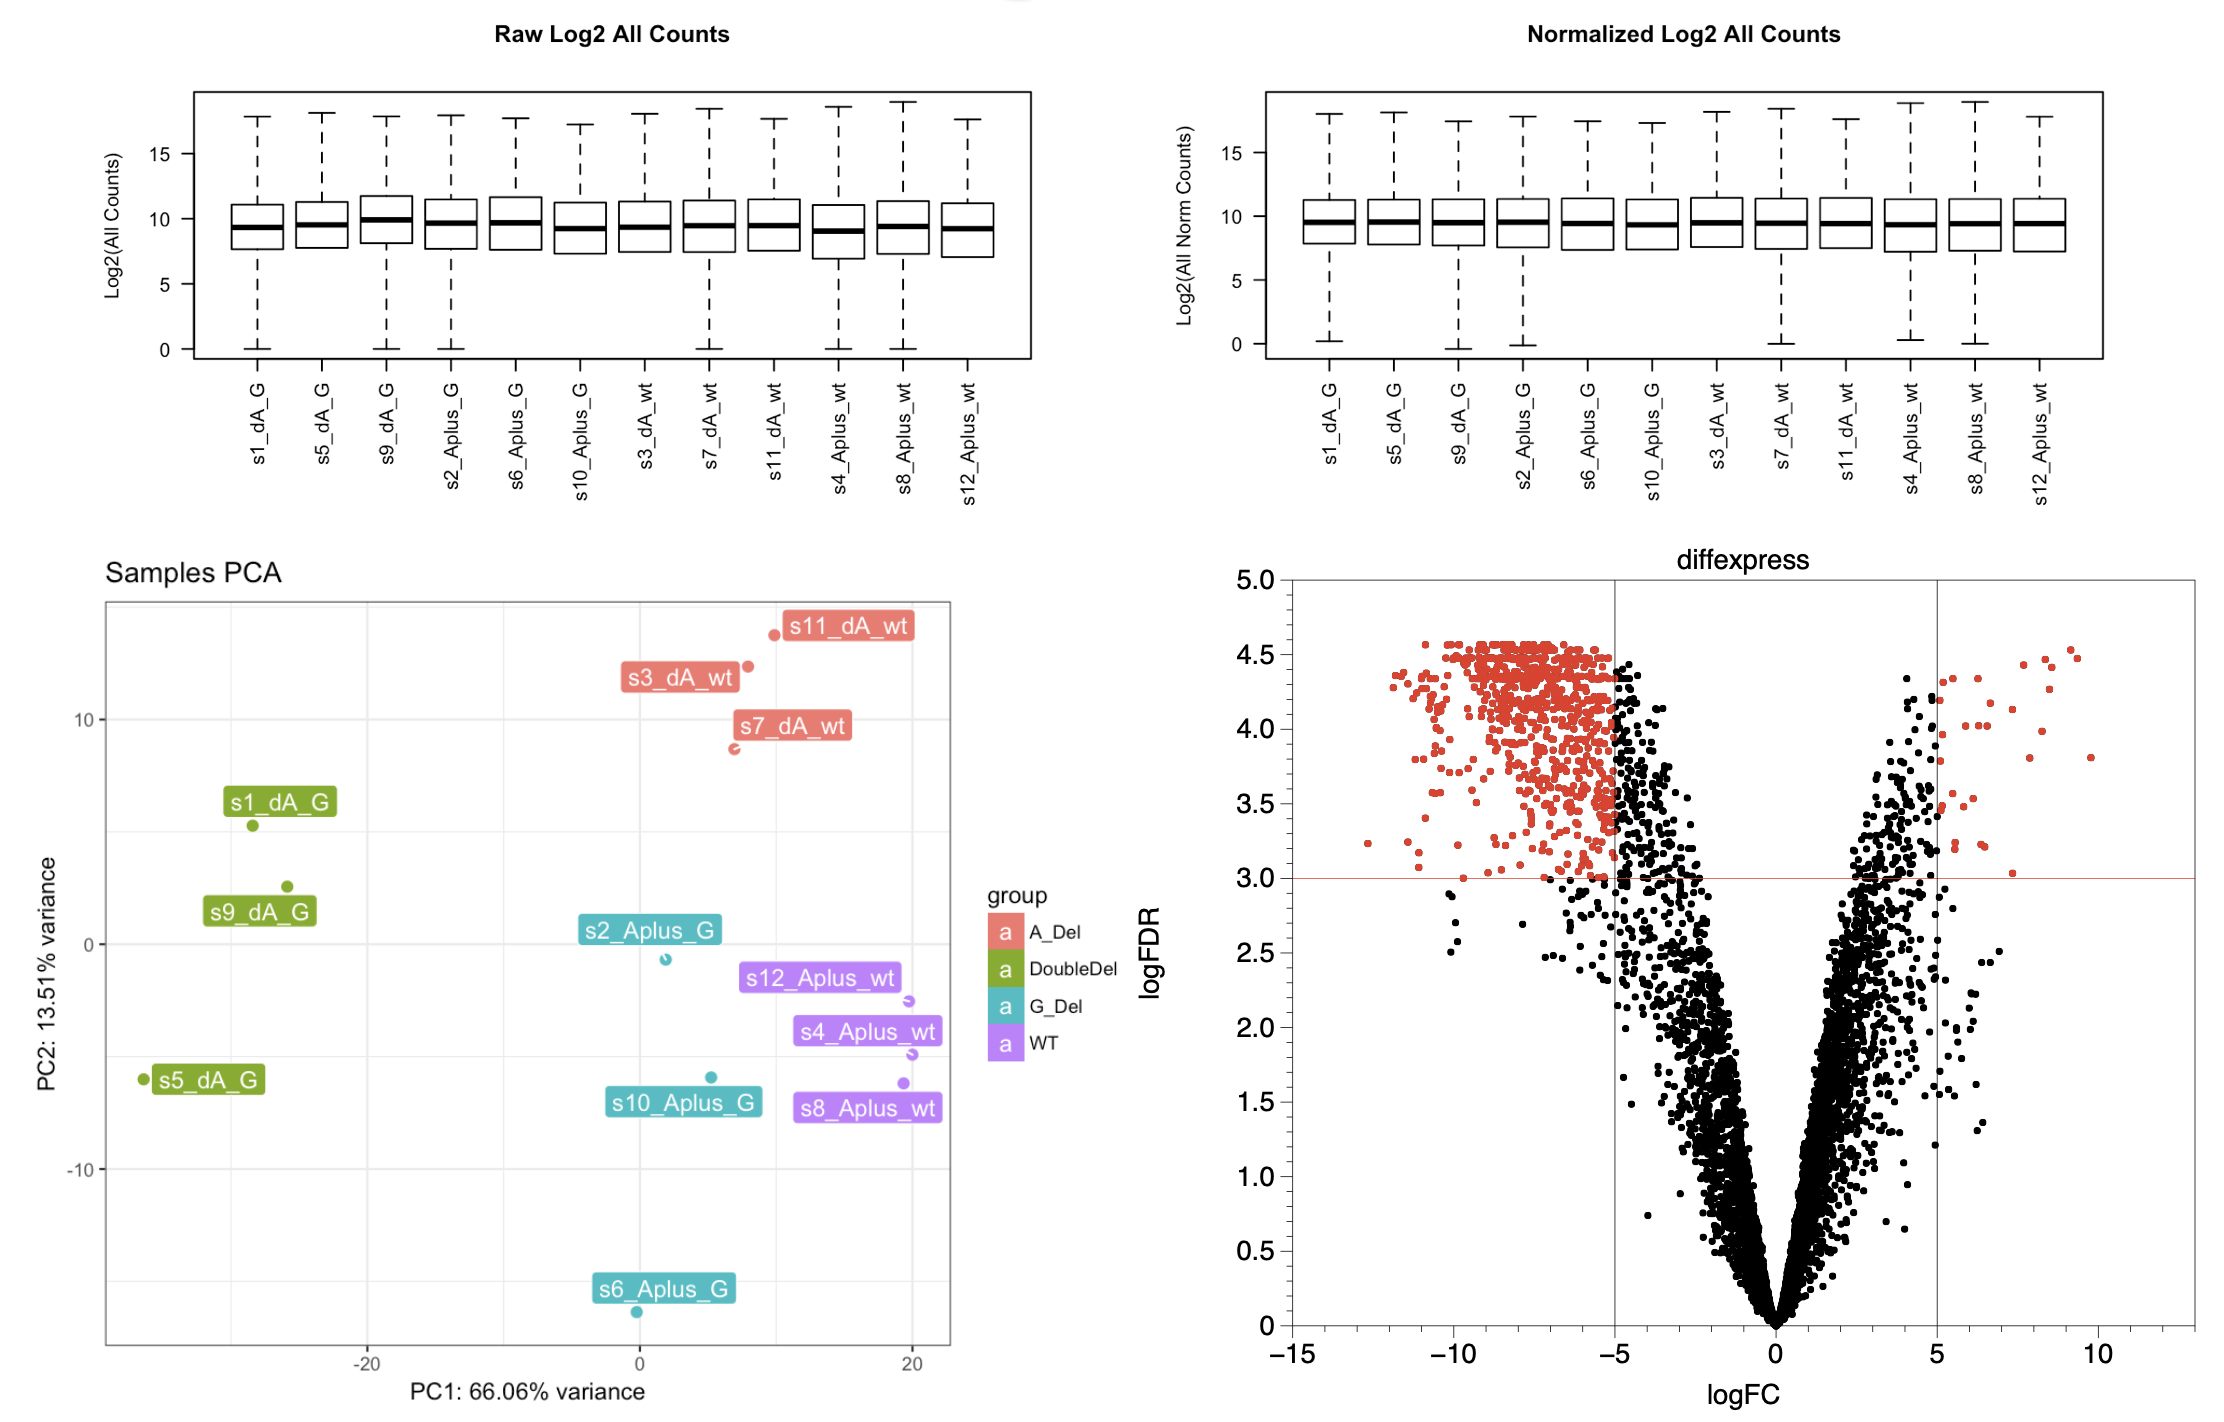 PCA and Volcano plots