Database for Annotation, Visualization and Integrated Discovery (DAVID) - practicing what we learned
Learning objectives
In this practice session, we will practice using DAVID.
Practicing what we learned
To help us apply what we learned during the lesson, we are going to use DAVID to obtain some functional annotation information on upregulated genes in the HCC1395 dataset. Recall that the HCC1395 dataset is derived from a study that profiled the transcriptome of HCC1395 breast cancer cell line and the HCC1395BL lymphoblastoid line, which makes this a tumor versus normal transcriptome comparison -- Griffith lab RNA sequencing course
Getting the data
The genes that exhibit higher expression in the tumor tissue (ie. log2 fold change ≥ 1 and false discovery rate ≤ 0.05) have been subsetted into the file hcc1395_deg_chr22_up_genes.txt.
Upload the data to DAVID
Before uploading the data, open hcc1395_deg_chr22_up_genes.txt to see what the content looks like. These should resemble gene symbols so select "OFFICIAL_GENE_SYMBOL" as the identifier type in Step 2. However, as a hint, DAVID might not recognize these and may divert you to the gene identifier conversion tool. If it does divert you, convert these to ENSEMBL_GENE_ID. At the gene ID conversion tool, how many IDs are available for conversion? Thus, out of the 157 genes that we are starting with, how many can we use in functional annotation analysis?
Solution
We are left with 108 genes
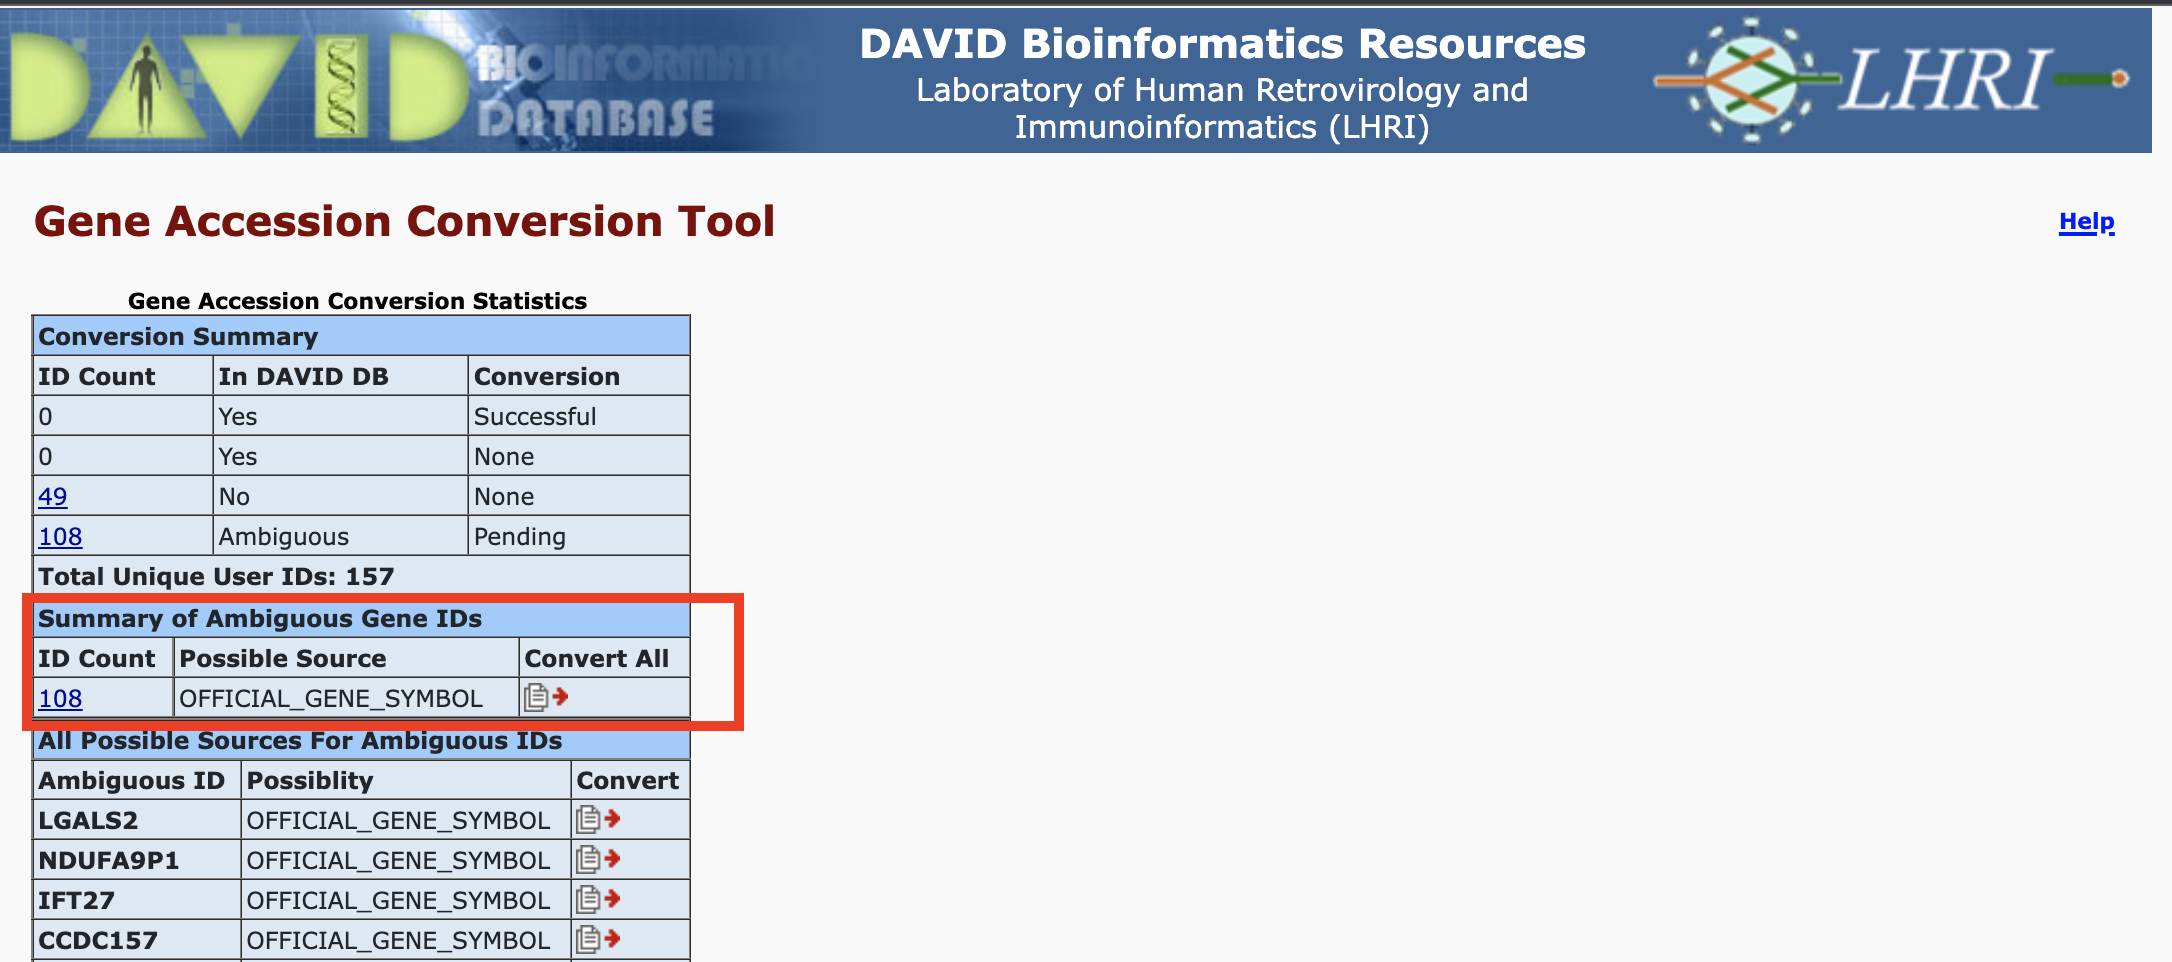
Convert the gene IDs and then submit the converted IDs as a gene list called hcc1359_deg_chr22_up.
Results
Gene Functional Classifier
Using the Gene Functional Classifier to group genes with similar annotations, how many clusters do we get?
Solution

Potential Diseases
Now, run the Functional Annotation Tool. Look at the gene wise view for DISGENET, are there any genes in our input that map to cancer?
Solution

Gene Ontology
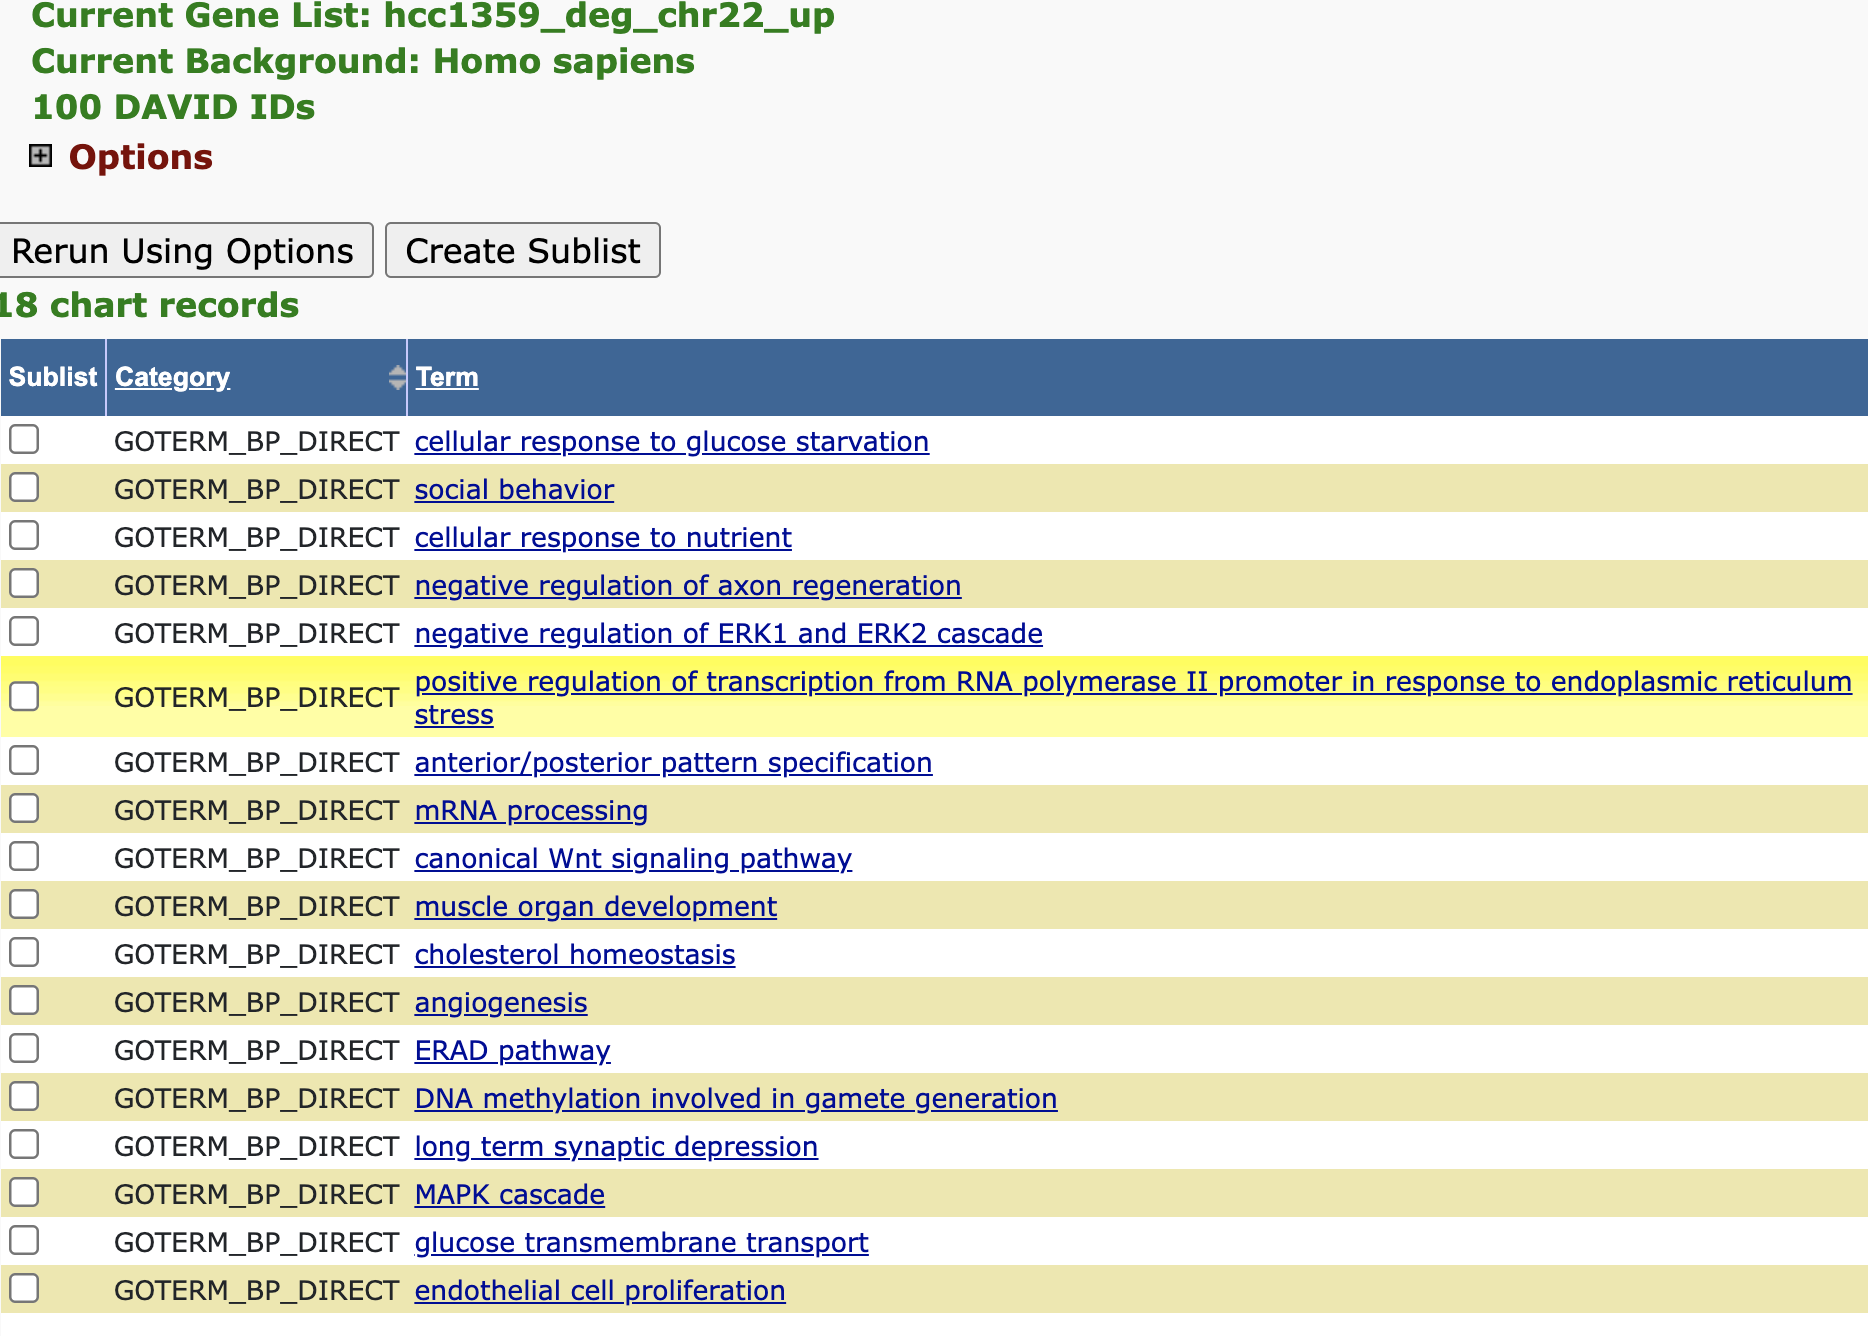
Go under the Gene Ontology section in the Annotation Summary Results and expand on it. Click the chart view for GOTERM_BP_DIRECT to look at some biological processes that the upregulated genes in the dataset map to. What are some of the processes? Does it make sense that we get genes that are expressed higher in the tumor samples mapping to these processes?
Solution
- cellular response to glucose starvation
- cellular response to nutrient
- angiogenesis
- glucose transmembrane transport
Functional Annotation Clusters
How many annotation clusters were generated using default parameters?
Solution
15 clusters were generated

Look thoroughly through the annotations, are any expected annotations and unexpected ones given that this is a tumor versus normal comparison dataset?