Lesson 14 Practice
Objectives
Here, we will practice using the Integrative Genome Viewer (IGV) to visualize the hcc1395 RNA sequencing alignment results.
About the data and launching IGV
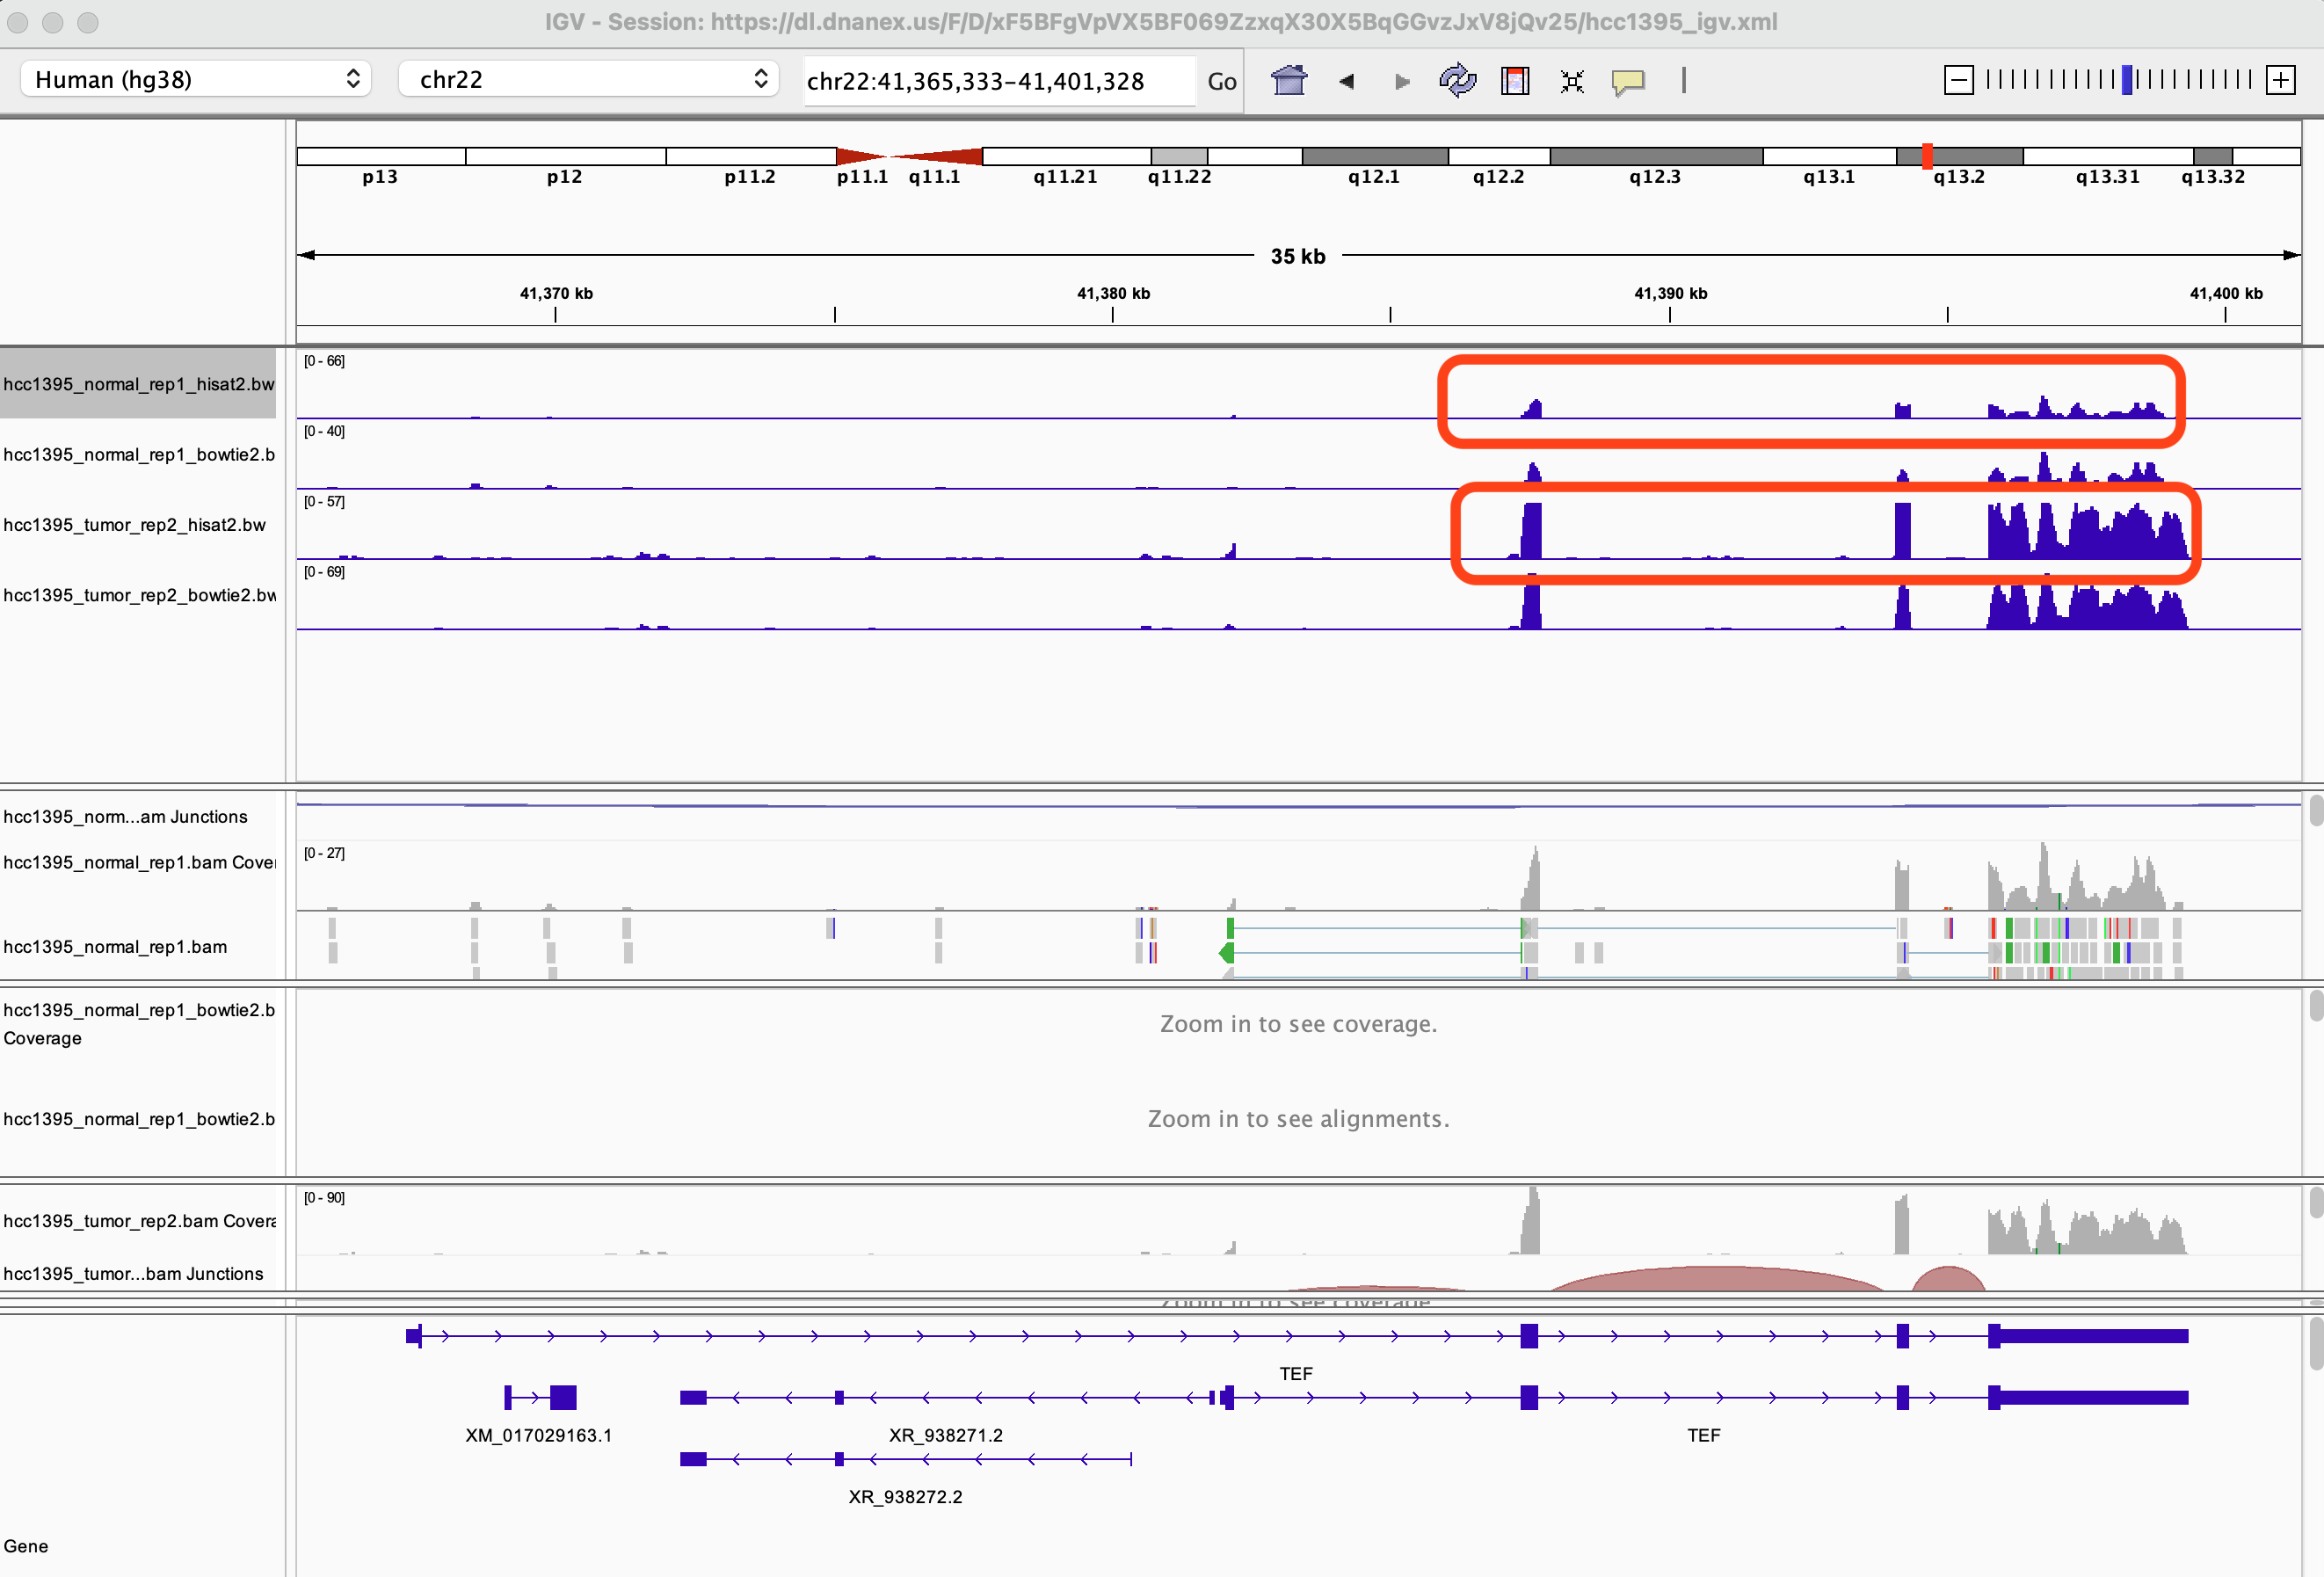
We were introduced to the hcc1395 RNA sequencing data in Lesson 12 practice session. This study compared the transcriptome of hcc1395 normal and cancer cell lines so it's a normal versus tumor comparison. This dataset was obtained from rnabio and was subsetted to reads that map to human chromsome 22. In Lesson 12 practice, we did QC for and trimming of the FASTQ files for this dataset. Even though we have not gone over the alignment step, the alignment output has been pre-generated for this IGV exercise. See Figure 1 and Figure 2 on how to view the hcc1395 alignment output in IGV.
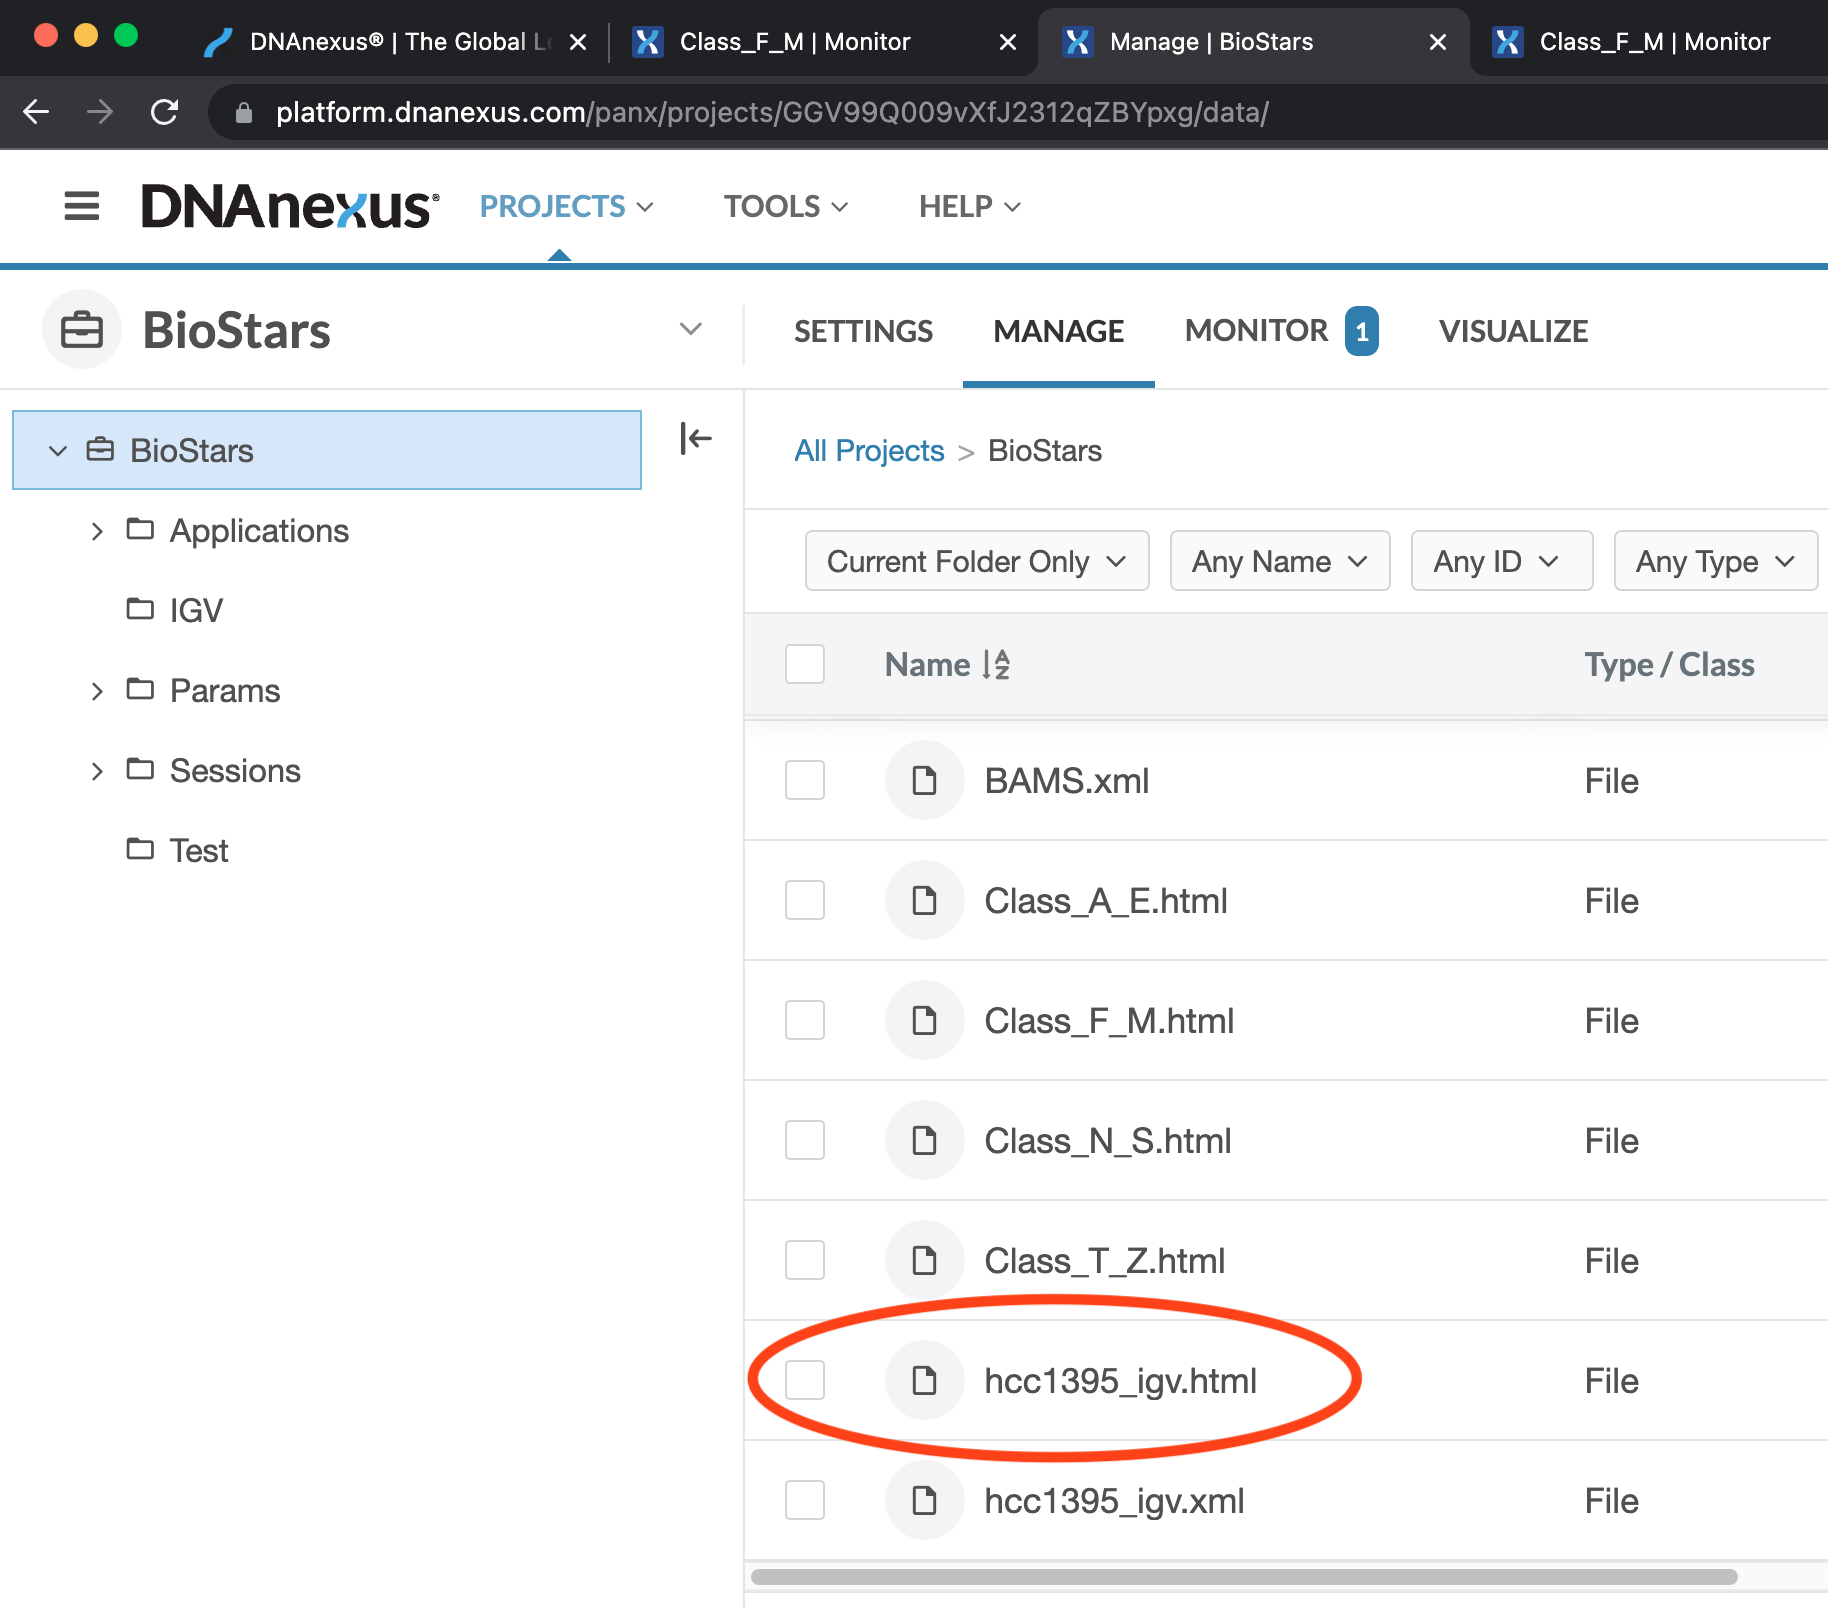
Figure 1: Click on the hcc1395_igv.html under All Projects -> BioStars to access the IGV launcher for the hcc1395 dataset.

Figure 2: Click the launch button to view the alignments for samples hcc1395_normal_rep1 and hcc1395_tumor_rep2.
In IGV, we are visualizing the alignments for samples hcc1395_normal_rep1 and hcc1395_tumor_rep2 to get a glimpse of gene expression differences in normal versus tumor. We also want to compare the alignment results derived from HISAT2 (splice aware) and Bowtie2 (splice unaware). The Bowtie2 BAM filenames have "_bowtie2" appeneded.
Testing your knowledge
Which reference genome are we using in this IGV session to view the alignment results for samples hcc1395_normal_rep1 and hcc1395_tumor_rep2?
On what chromosome are the sequencing data mapping to?
Solution
We are using human hg38 and the reads map to chromosome 22

The peaks in the bigWig (bw) tracks, what do these represent?
Solution
The peaks in the bigWig (bw) tracks represents sequencing coverage
Upon opening of IGV, the bam tracks are empty, how do we zoom in to start viewing information?
Solution
We can either select by chromosome, search by gene name or coordinates, or use the zoom feature

Search for the TEF gene, does there appear to be difference in gene expression between the normal and tumor sample?
Solution
It appears that the tumor sample is expressing more TEF than normal
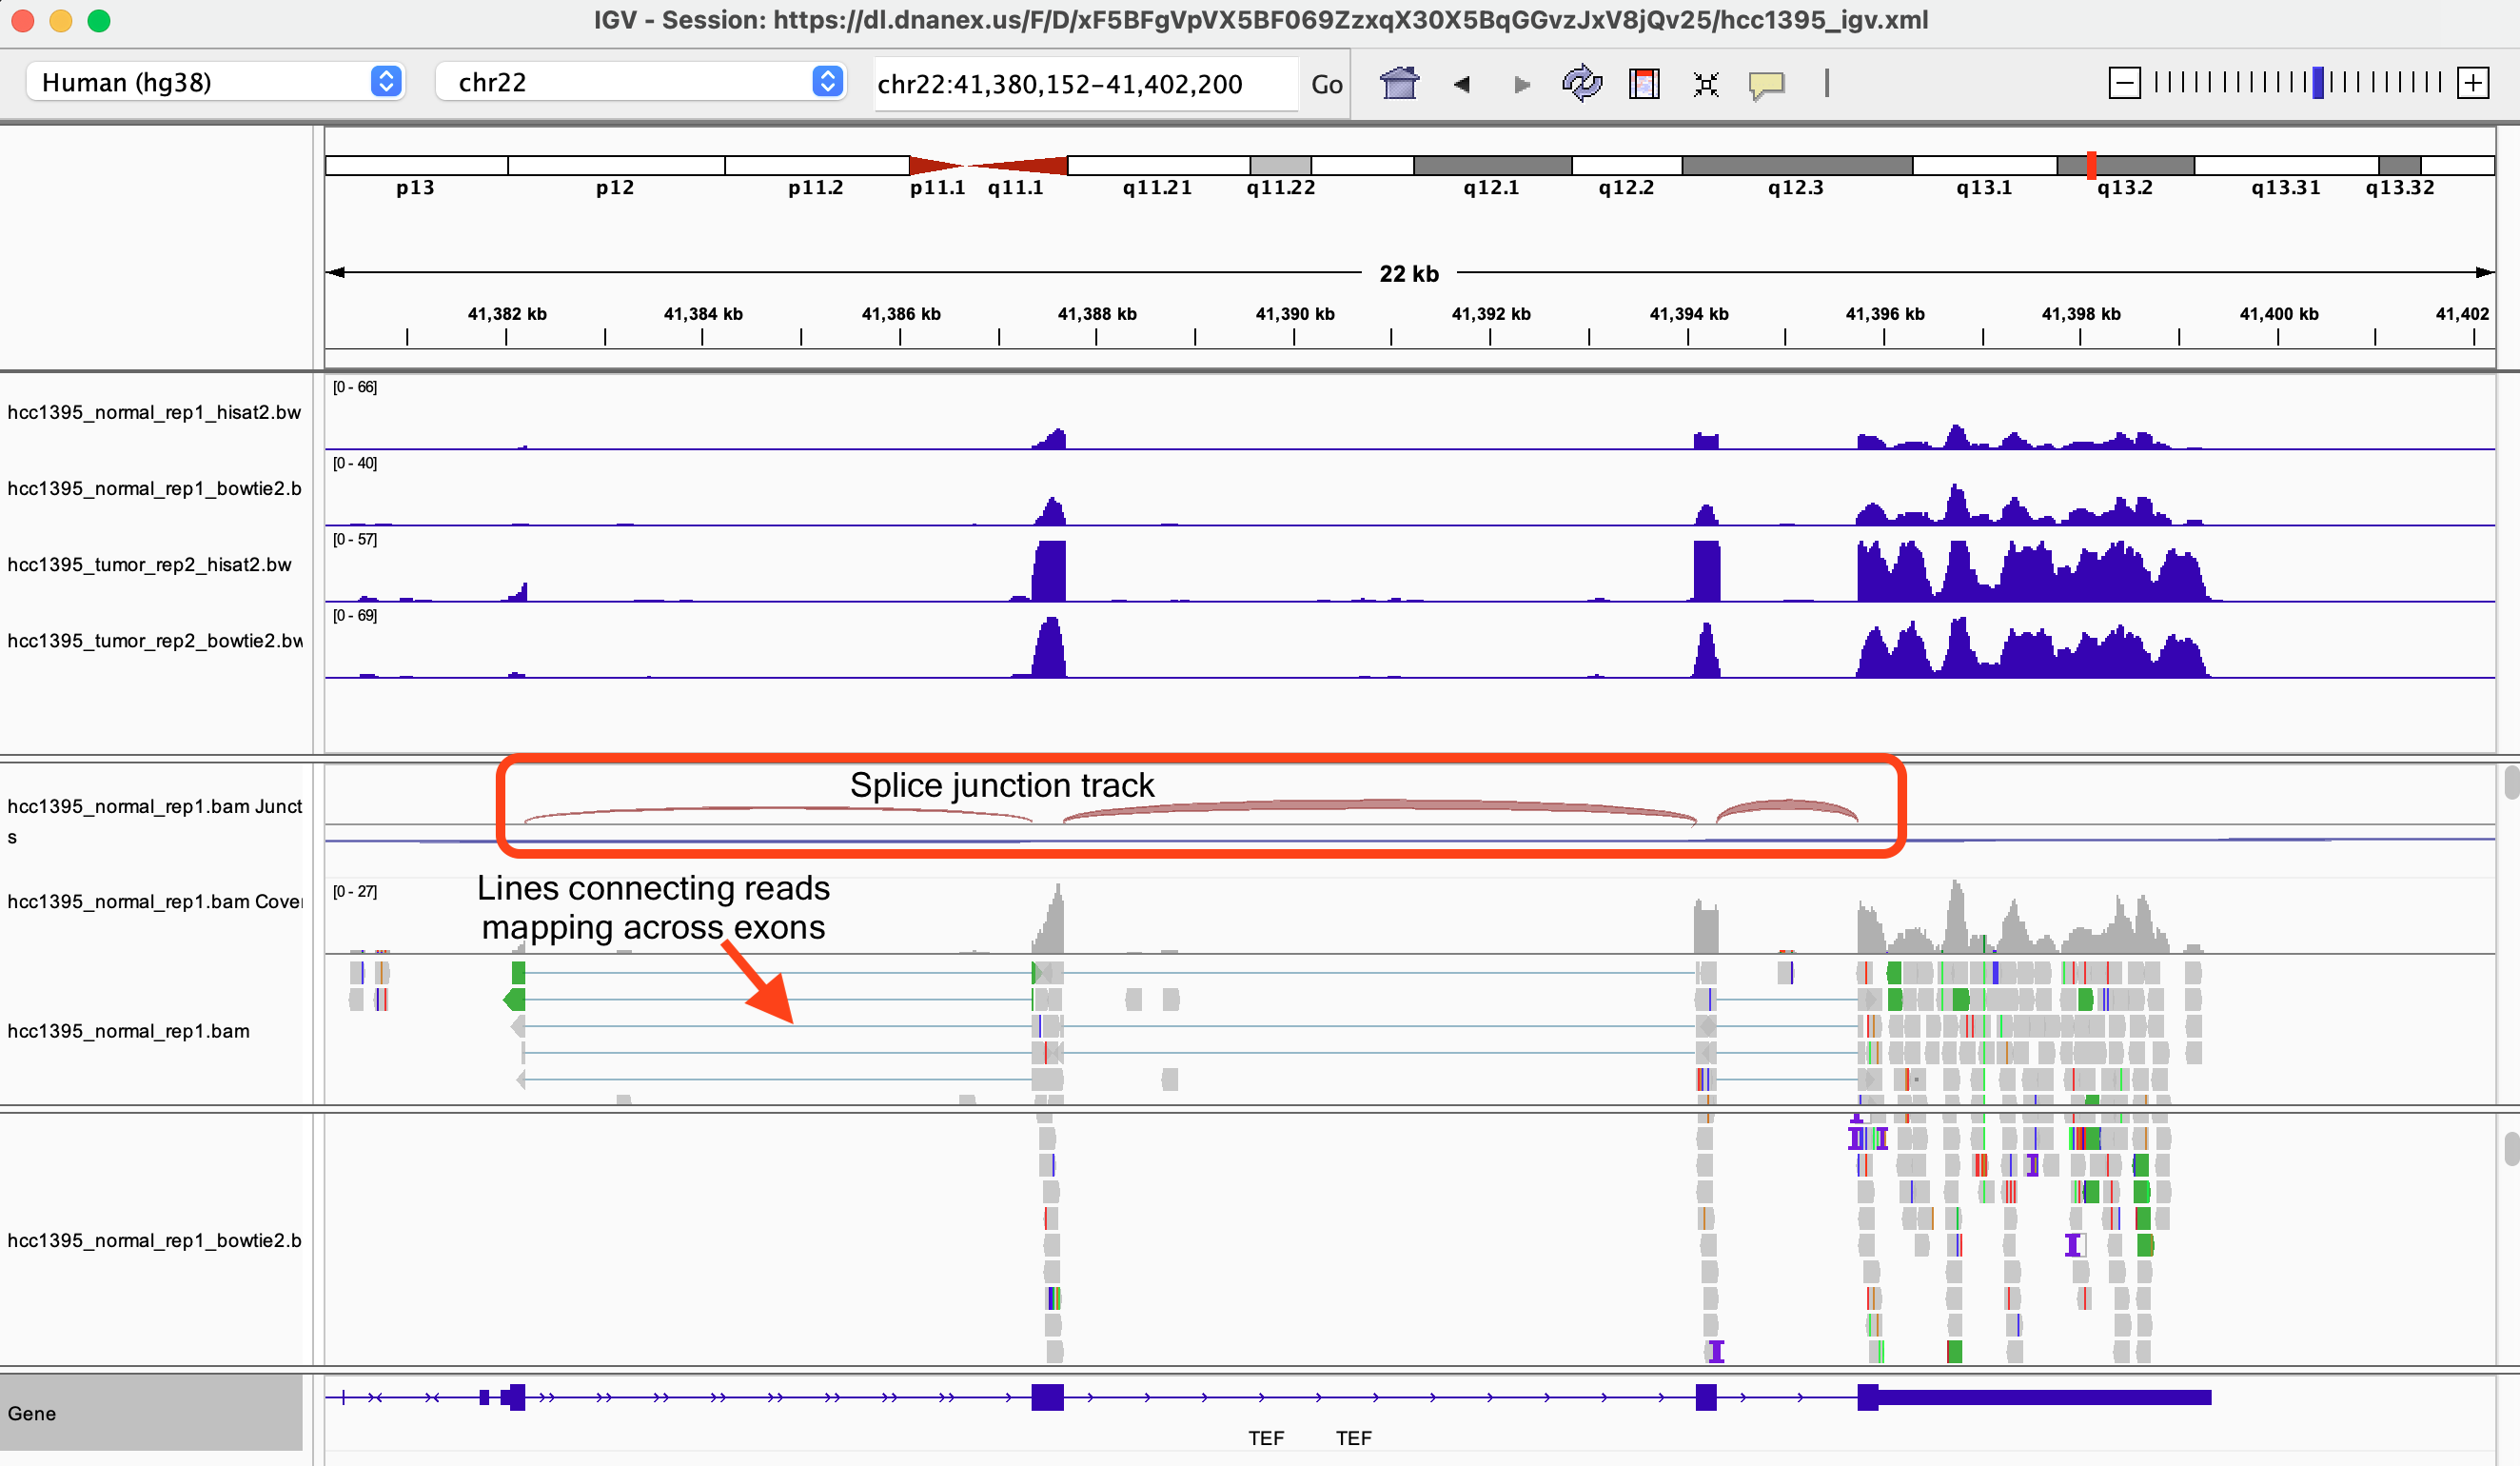
You might have to remove the hcc1395_tumor_rep2 tracks for this but what is the difference between the HISAT2 and Bowtie2 alignment for the hcc1395_normal_rep1 sample?
Solution
The HISAT2 alignment have the extra splice junction track and the reads that map across exons are connected by lines
In position 50,768,105 on chromosome 22, what is the blue-red color in the hcc1395_normal_rep1 BAM coverage track telling us?
Solution
It's telling us that there could be a potential single nucleotide variant as we observed C's in addition to T's at this position. There is a T in the reference.

Bonus question
Work on this if you choose to, at your own leisure, or if time permits.
How would you confirm that there is a potential single nucleotide variant at position 50,768,105 on chromosome 22 for the hcc1395_normal_rep1 sample?
Solution
Goto File and select Load from server
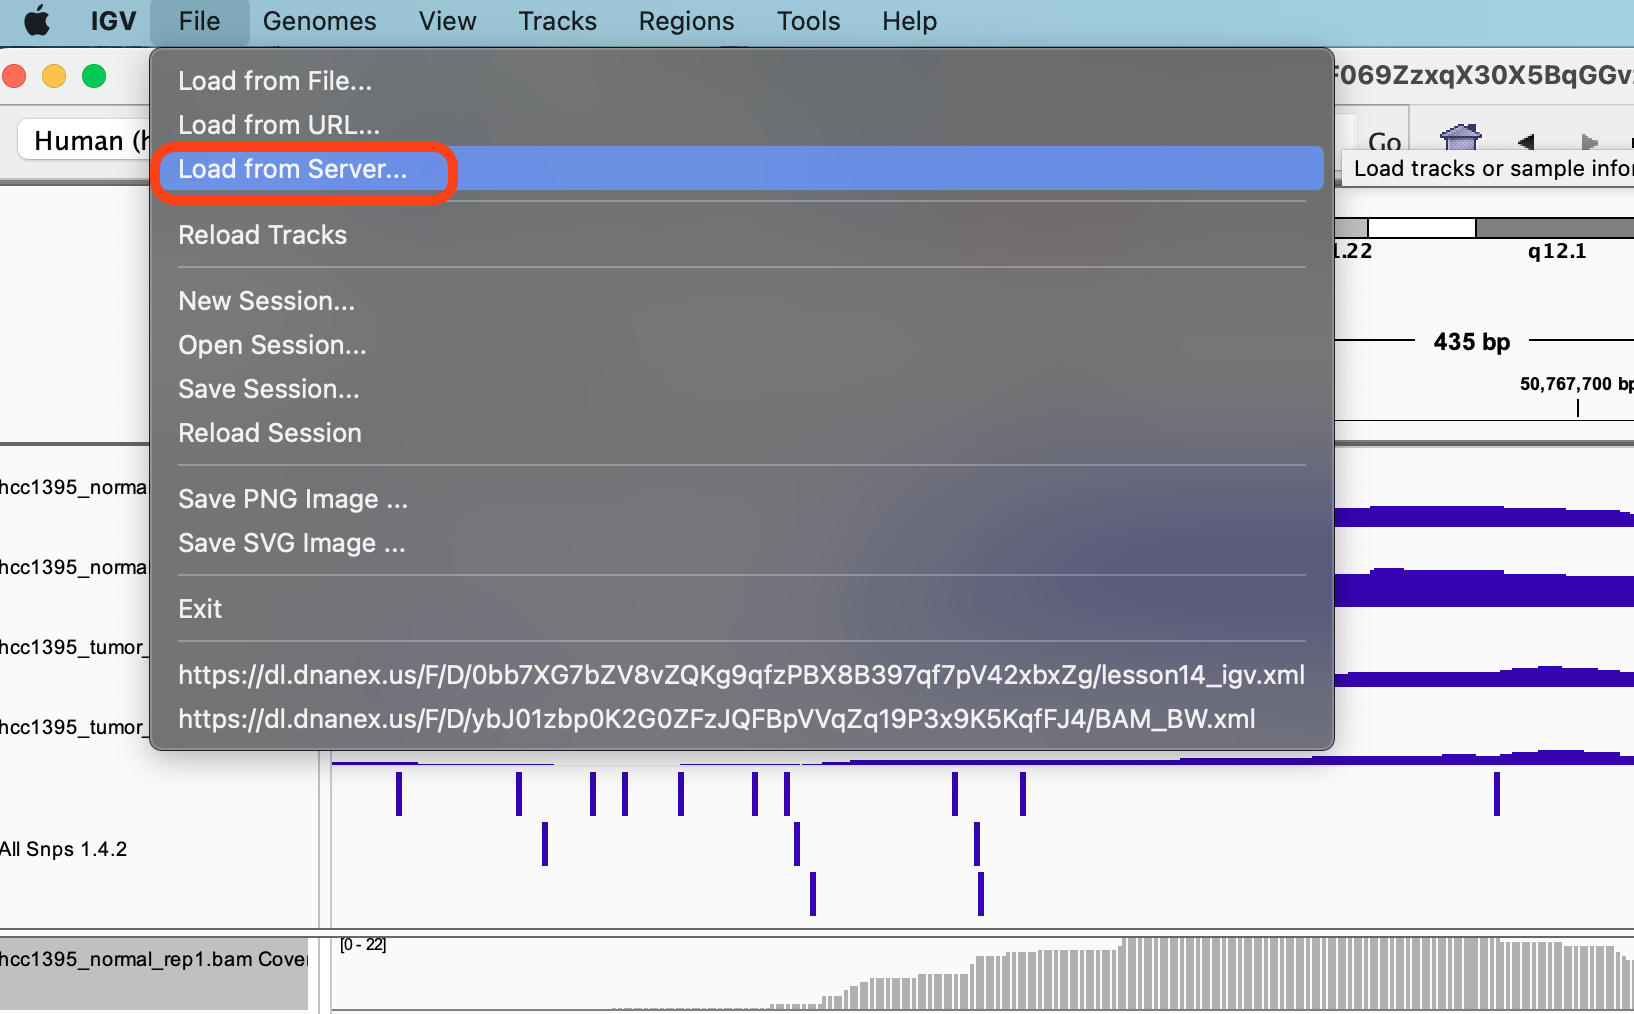
In the Available Datasets box, choose Annotations -> Variation and Repeats -> All Snps

We see that there is indeed a potential SNP here and if we click on it we will see more information about the potential SNP.