Differential Expression
Differential expression involves the comparison of normalized expression counts of different samples and the application of statistical measures to identify quantitative changes in gene expression between the different samples.
Normalization and Statistical Significance
Two Statistical Components:(Remember all statistical methods rely on various assumptions regarding the characteristics of the data...if they are not true all bets are off).
-
Normalization of counts - the process of ensuring that values are expressed on the same scale (e.g. RPKM, FPKM, TPM, TMM). Corrects for variable gene length, read depth.
-
Differential Expression - analysis of the difference in expression of genes under two conditions (pair wise comparison) - expressed as fold difference. A statistical test determines whether the observed difference is statistically significant (i.e. the likelihood of the observation is greater than that expected from random biological variability). Such analyses are typically based on a negative binomial distribution - expressed as P or corrected P value.
Replicates
Biological replicates are essential to derive a meaningful result. Don’t mistake the high precision of the technique for the need for biological replicates.
If technical or biological variability exceeds that of the experimental perturbation you will get zero DEs.
Remember not all DE may be directly due to the experimental perturbation, but could be do to cascading effects of other genes.
Multiple Testing Correction
Differential Expression data must be corrected for multiple testing. Two common methods are the “Bonferroni procedure” and “Benjamini–Hochberg procedure”. These forms or statistical correction will result in a “corrected pvalue”, or a qvalue or FDR or padj (adjusted p value).
Note pvalues refer to the each gene, whereas an FDR (or qvalue) is a statement about a list. So using FDR cuff of 0.05 indicates that you can expect 5% false positives in the list of genes with an FDR of 0.05 or less.
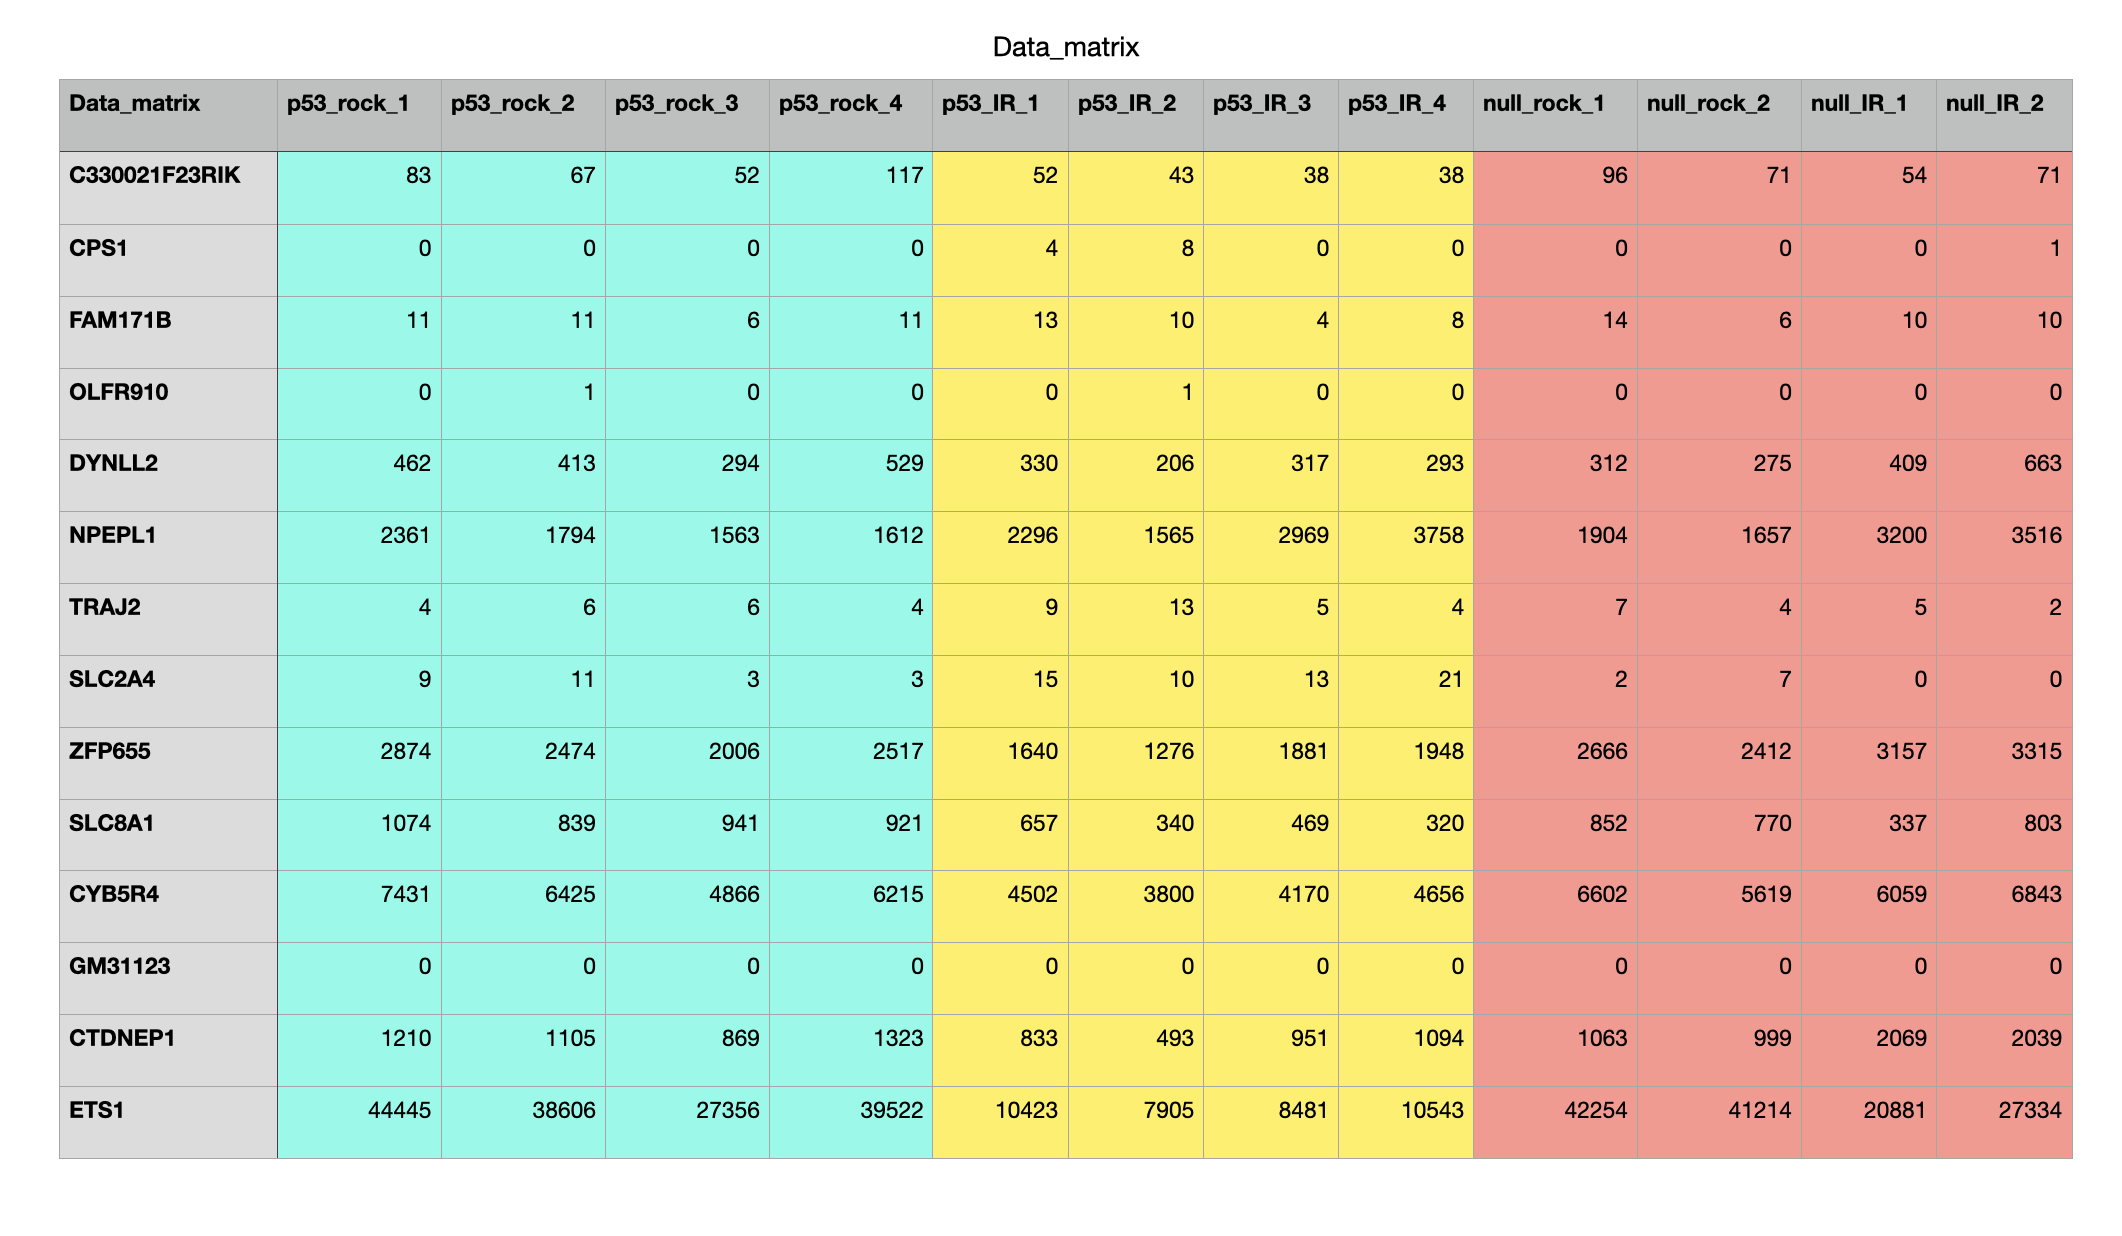
Count Matrix
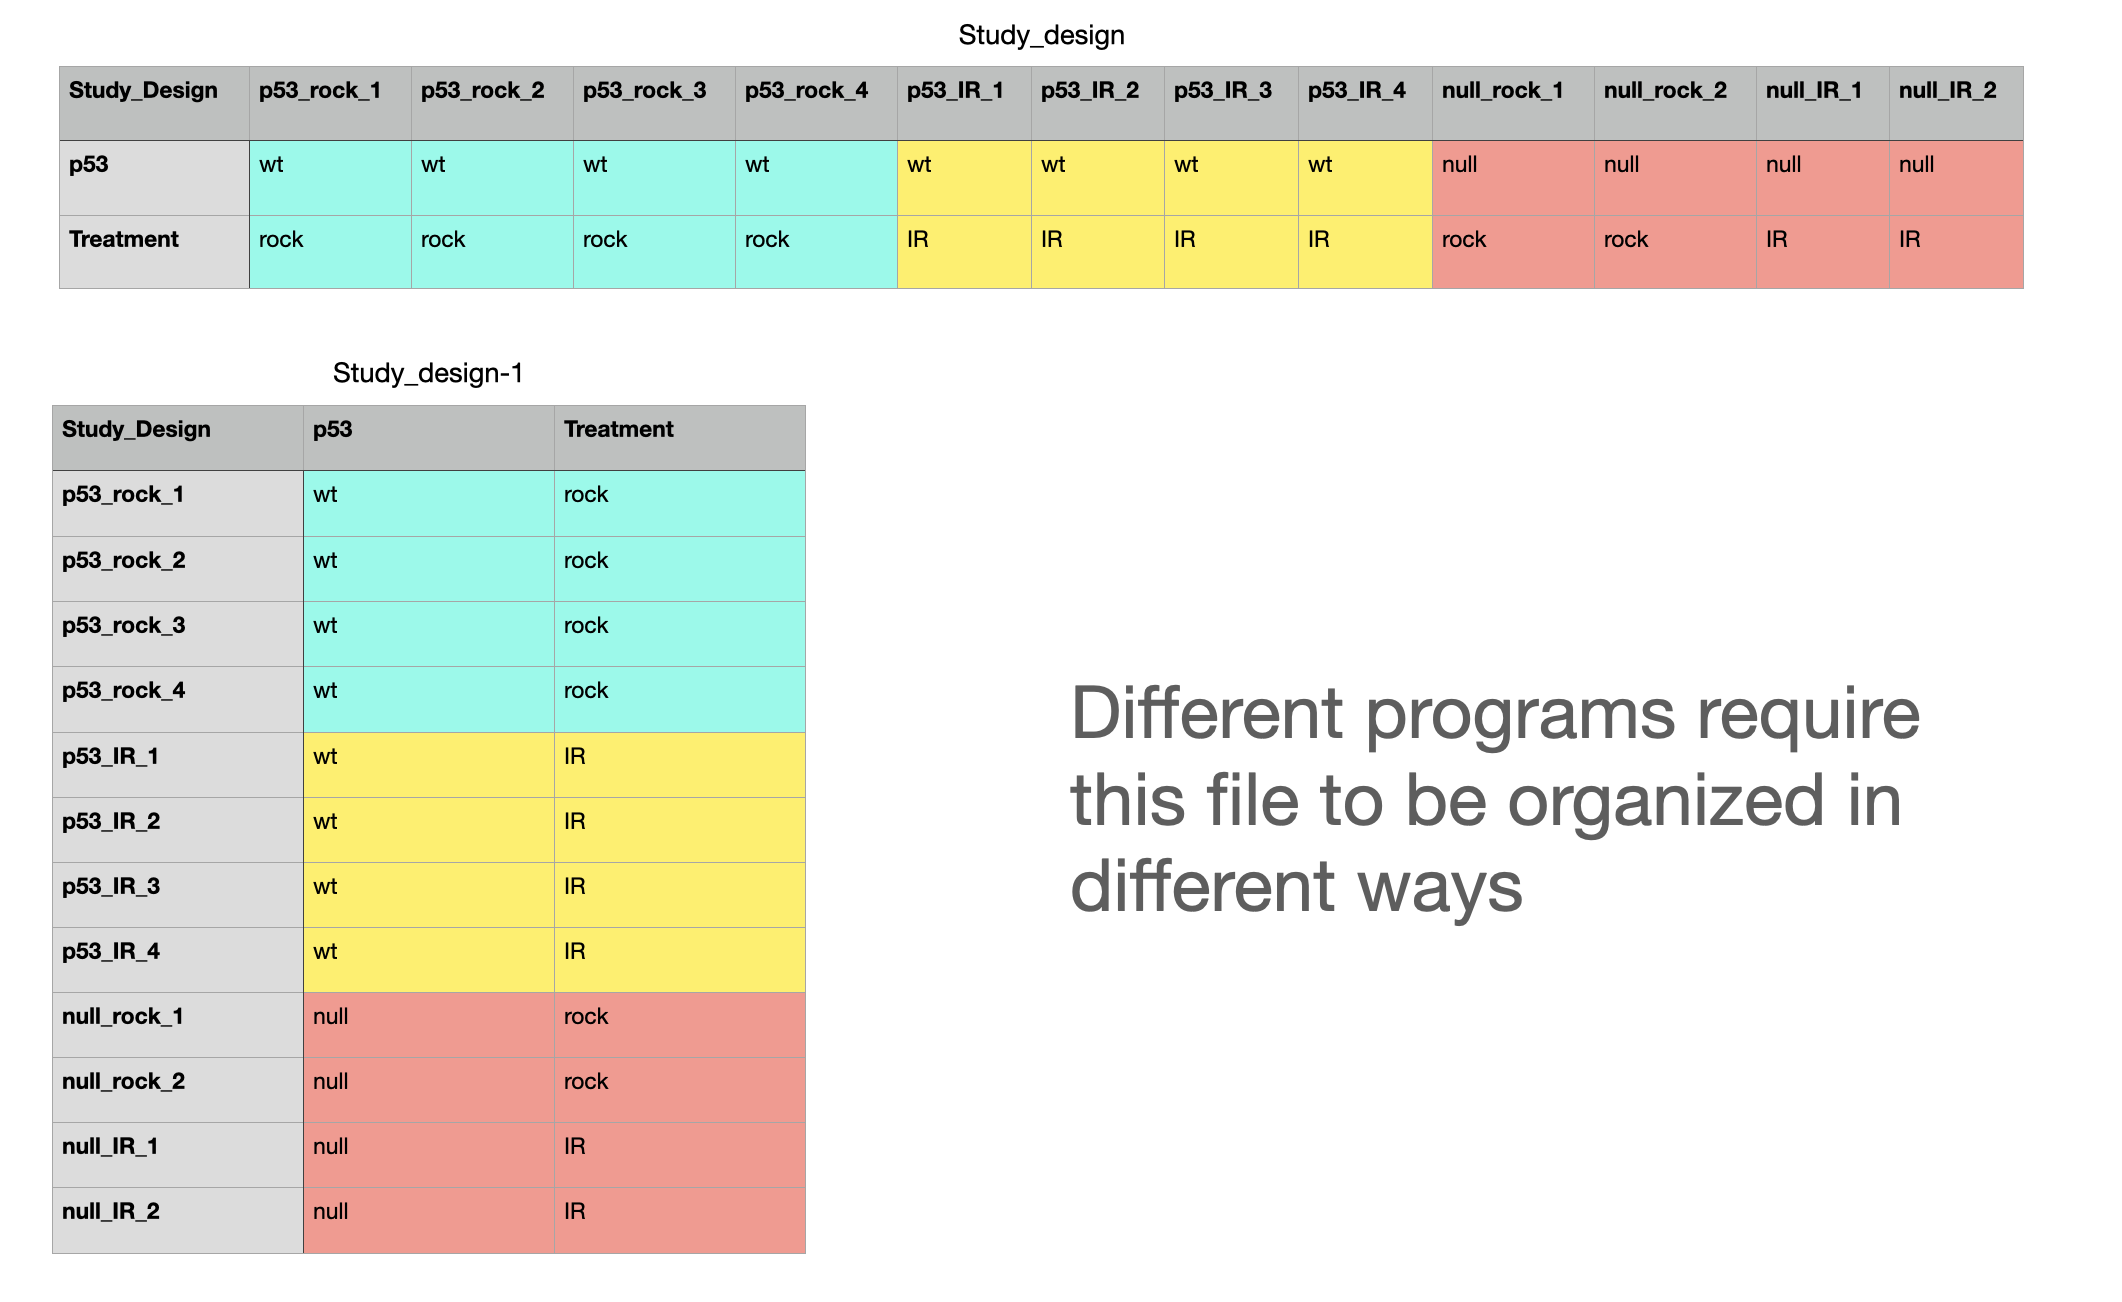
Contrast File
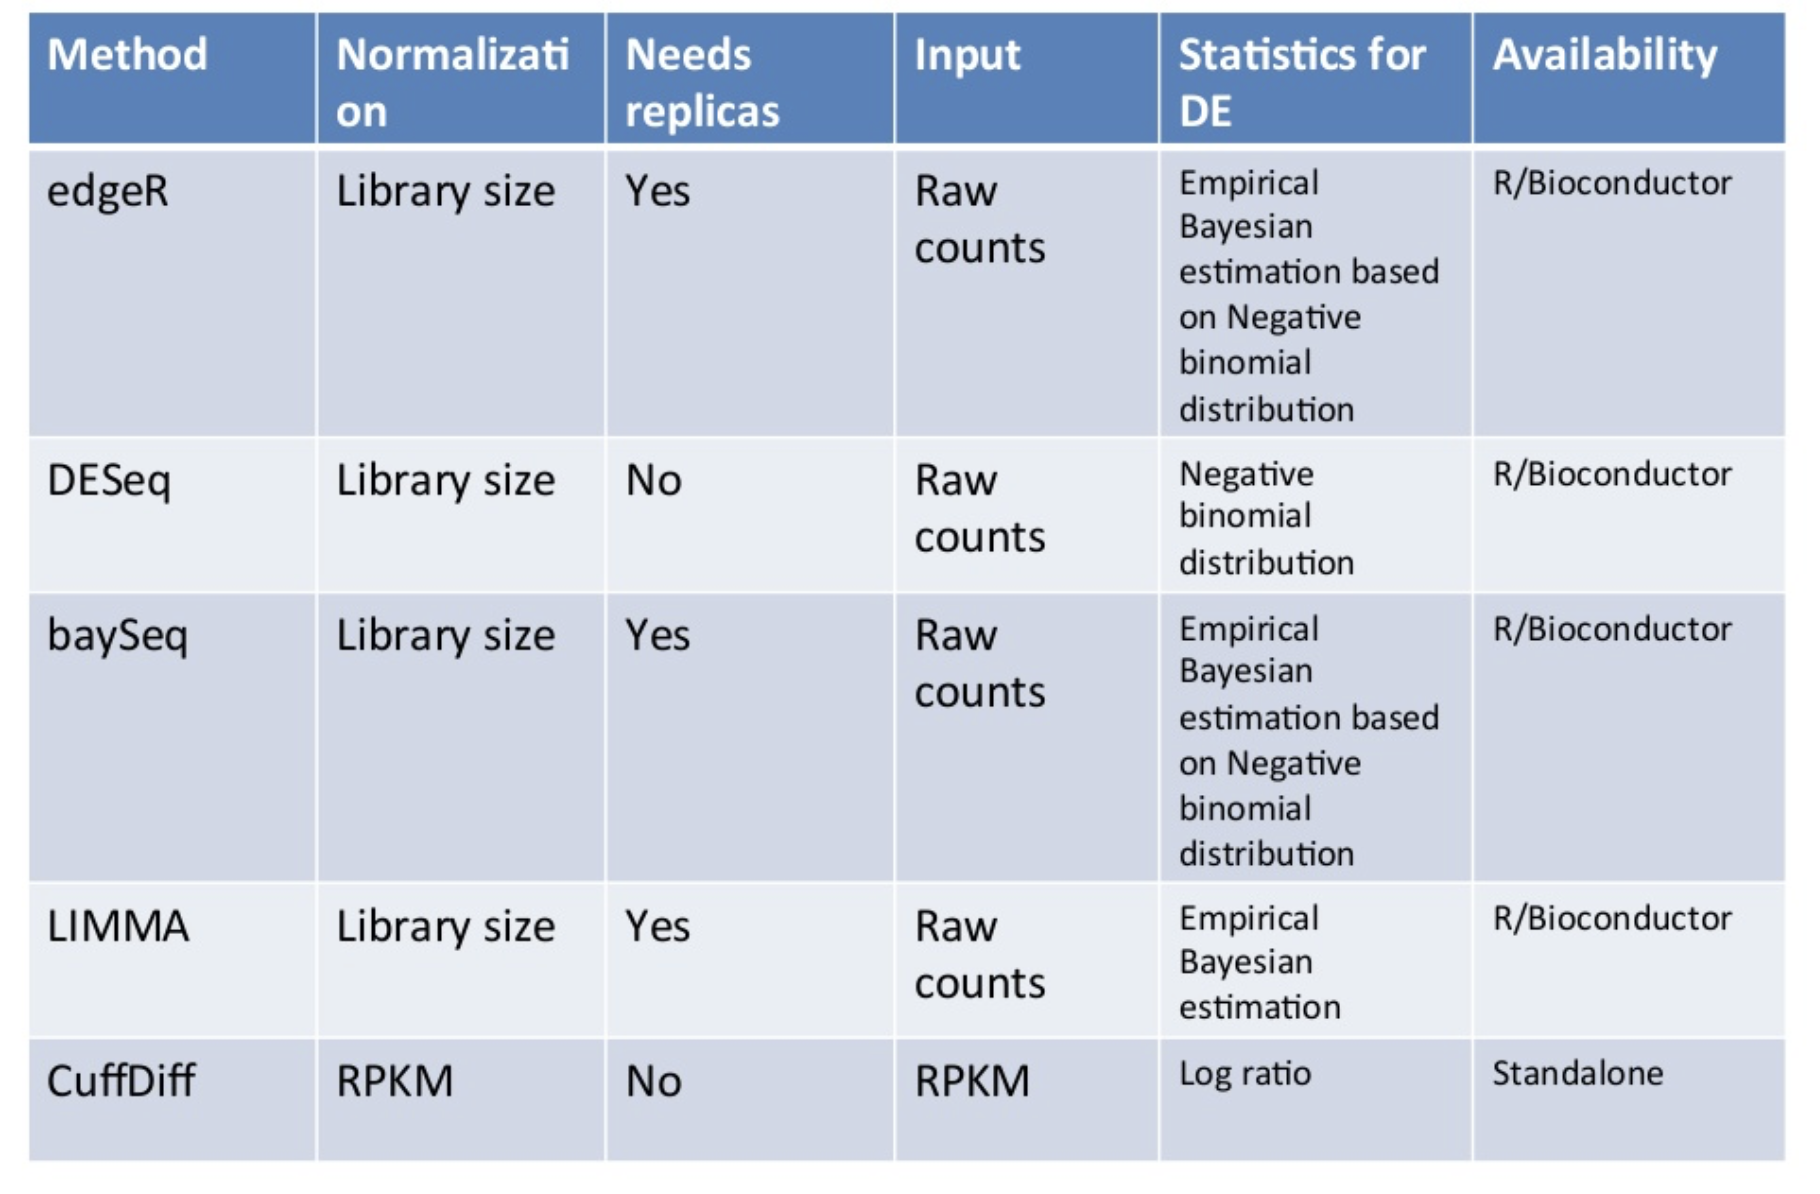
Differential Expression Programs
Differential Expression Output
Final output is typically a rank order list of differentially expressed (DE) genes with expression values and associated p-values. Here are examples from teh programs EdgeR and DESeq2
