Gene ontology and pathway analysis
Objectives
- Determine potential next steps following differential expression analysis.
- Tour geneontology.org and understand the three main ontologies.
- Learn about different methods and tools related to functional enrichment and pathway analysis.
- Get familiar with databases commonly used by popular functional enrichment tools.
Where have we been and where are we going?
Thus far we have:
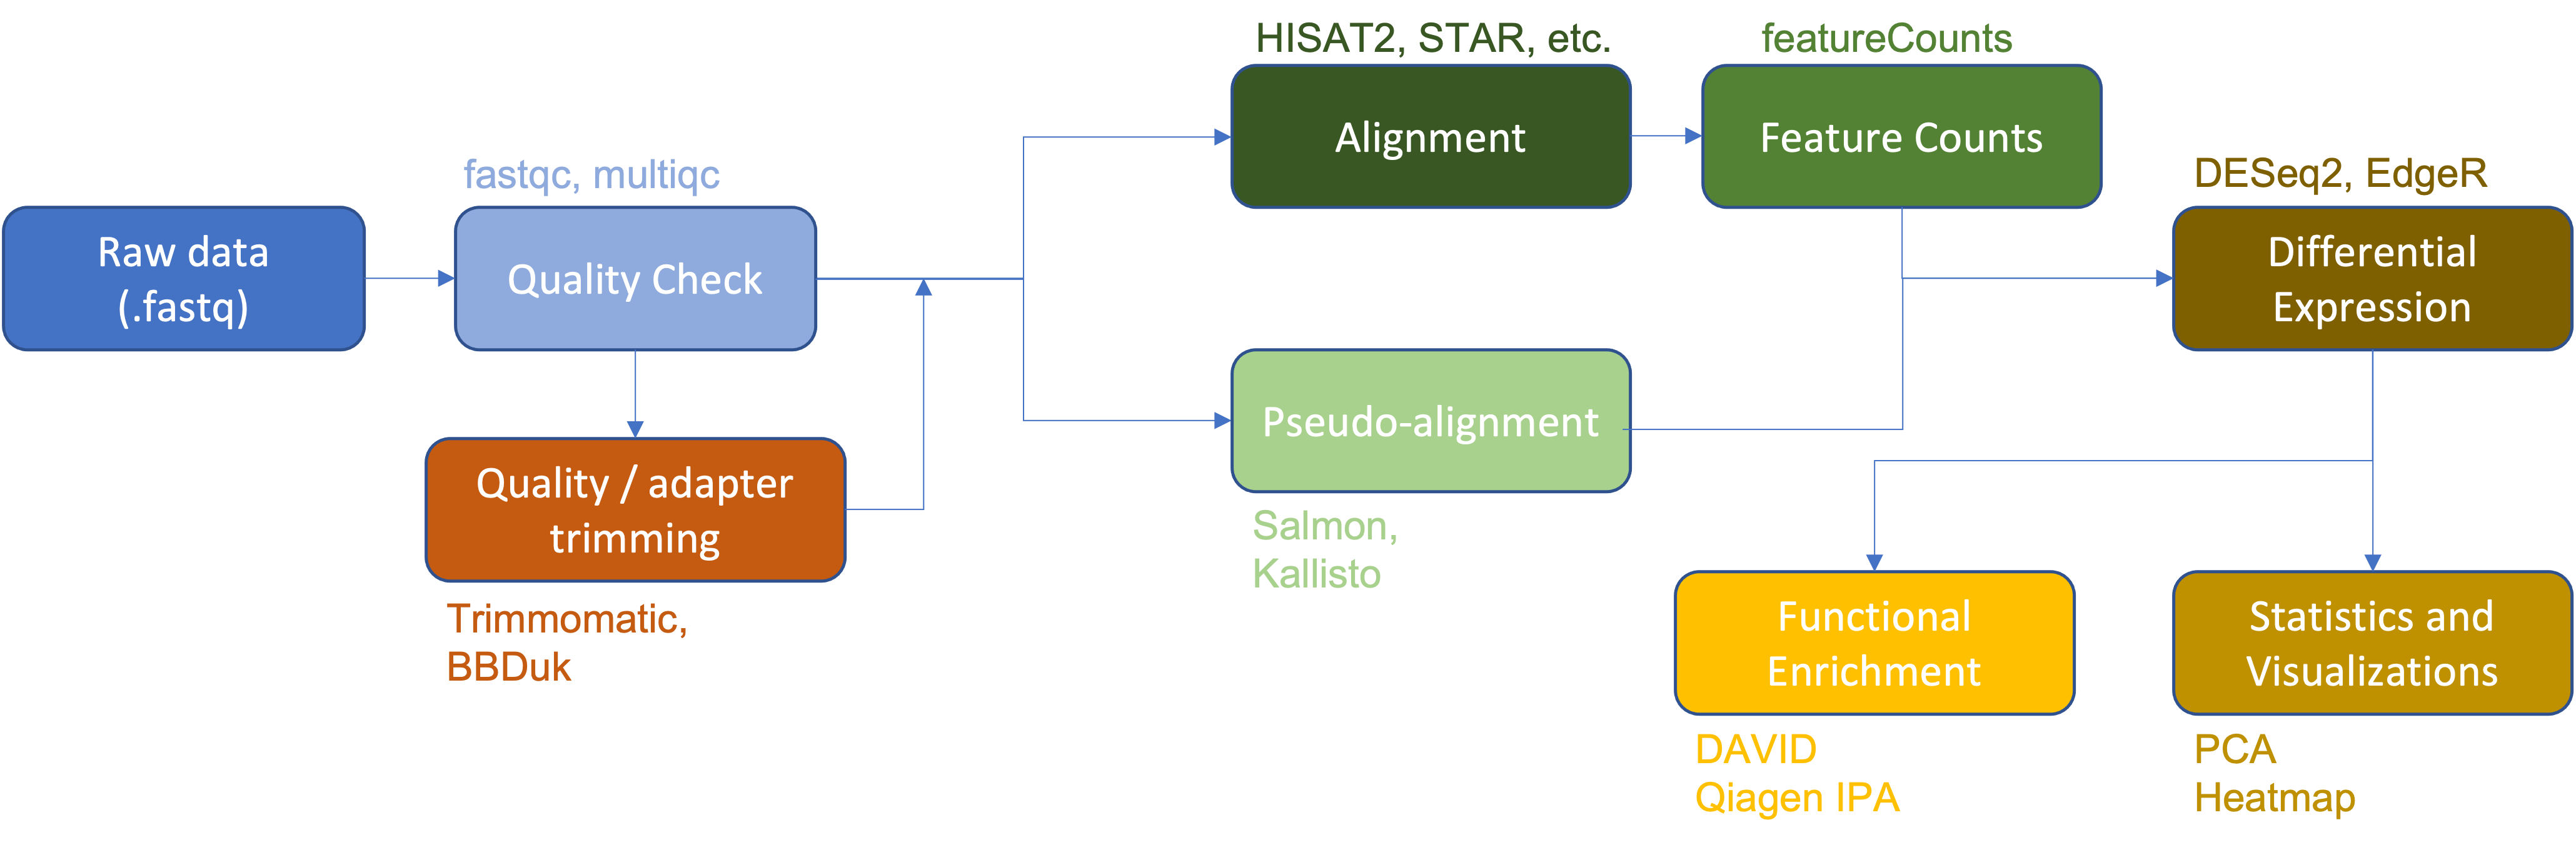
- Downloaded raw RNA-Seq data (.fastq files).
- Examined raw data quality using
fastqcandmultiqc. - Performed adapter and quality trimming using
Trimmomatic. - Aligned the raw sequences to a reference genome (human chromosome 22 from the GRCh38 version of the human reference genome) using
HISAT2. - Viewed and compared alignments using IGV.
- Generated a gene count matrix using
featureCounts. - Performed differential expression analysis (
DESeq2,EdgeR). - Generated a heatmap of differentially expressed genes.

Heatmap of differentially expressed genes (HBR vs UHR).
You now have a potentially large list of differentially expressed genes. Now what? If you are like most biologists, you are interested in understanding these genes within their biological context.
To do that, we can examine gene ontology and perform some type of functional enrichment analysis or pathway analysis.
These types of analyses exploit the use of gene sets, and not all gene sets represent a pathway. Gene sets, which are collections of genes "formed on the basis of shared biological or functional properties as defined by a reference knowledge base. Knowledge bases are database collections of molecular knowledge which may include molecular interactions, regulation, molecular product(s) and even phenotype associations" Mathur et al. 2018.
Whereas, a pathway is not a simple list of genes but rather includes an interaction component usually related to a specific mechanism, process, etc.
What is gene ontology?
Many of the tools used to understand functional enrichment will use sets of GO terms, examining GO enrichment. What do we mean by GO?
The Gene Ontology (GO) provides a framework and set of concepts for describing the functions of gene products from all organisms. --- https://www.ebi.ac.uk/ols/ontologies/go.
This is manually curated by team members of the GO consortium.
There are two parts to the gene ontology: (Check out https://www.youtube.com/watch?v=6Am2VMbyTm4 for a more detailed overview)
- the ontology (the GO terms and their hierarchical relationship) - form a directed, acyclic graph structure (nodes = GO terms, edges = relationships)
- the annotations (the annotated genes linked to various GO terms)
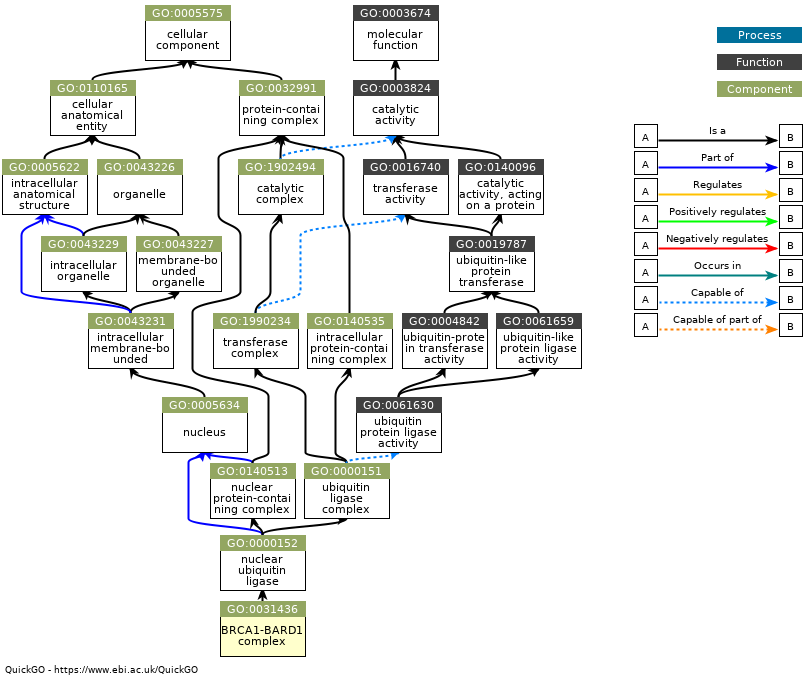
Image from https://www.ebi.ac.uk/QuickGO/GTerm?id=GO:0031436 .
What is a GO term?
- GO terms provide information about a gene product
- GO terms as a vocabulary are species agnostic, but there are species constraints
- ontology and annotations are updated regularly
- computer readable - suitable for bioinformatics
GO integrates information about gene product function in the context of three domains:
- molecular function (F) - "the molecular activities of individual gene products" (e.g., kinase)
- cellular component (C) - "where the gene products are active" (e.g., mitochondria)
- *biological process (P) - "the pathways and larger processes to which that gene product’s activity contributes " (e.g., transport)
*Commonly used for pathway enrichment analysis
Checkout geneontology.org.
Approaches to gene set analysis / pathway analysis?
Functional enrichment and pathway analysis have broad and varying definitions. For our purposes, there are three general approaches: 1. Over-Representation Analysis (ORA), 2. Functional Class Scoring (FCS), and 3. Pathway Topology (PT) (Khatri et al. 2012).
Examining genes in a set allows us to:
- increase the statistical power in our analysis
- ease interpretation
- predict new roles for genes
- better integrate data from different methods
Over-representation analysis (ORA)
statistically evaluates the fraction of genes in a particular pathway found among the set of genes showing changes in expression --- Khatri et al. 2012
From this, ORA determines which pathways are over or under represented by asking "are there more annotations in the gene list than expected?"
- tests based on hypergeometric, chi-square, or binomial distribution
- includes GO enrichment methods
- prioritizes a subset of genes using an arbitrary, user determined threshold
- doesn't require the data, just the gene identifiers
- Example tools include DAVID and Qiagen IPA
Functional Class Scoring (FCS)
Includes ‘gene set scoring’ methods such as GSEA, which first compute DE scores for all genes measured, and subsequently compute gene set scores by aggregating the scores of contained genes. --- Geistlinger et al. 2021
GSEA
- ignore gene position and role
- do not pre-select genes (considers all gene expression) and so you must include data with gene identifiers for ranking
- ranking by magnitude of change in gene expression between conditions
- determines where genes from a gene set fall in the ranking
- creates a running sum statistic
- uses a permutational approach to determine significance
- Broad Institute software but also available using web-based tools, R, and Qlucore (proprietary).
- also considered a strategy encompassing a range of methods
- self-contained methods vs competitive methods
What is MSigDB and how does it relate to GSEA?
- curated by the Broad Institute
- 33196 gene sets to be used in GSEA (not all gene sets are related to pathways)
- larger, themed collections
- human and mouse
Pathway Topology
ORA and FCS discard a large amount of information. These methods use gene sets, and even if the gene sets represent specific pathways, structural information such as gene product interactions, positions of genes, and types of genes is completely ignored. Pathway topology methods seek to rectify this problem.
PT methods are mostly considered network based.
Some examples:
Impact analysis (iPathwayGuide)
constructs a mathematical model that captures the entire topology of the pathway and uses it to calculate a perturbation for each gene. Then, these gene perturbations are combined into a total perturbation for the entire pathway and a p-value is calculated by comparing the observed value with what is expected by chance. (https://advaitabio.com/ipathwayguide/more-accurate-pathway-rankings-using-impact-analysis-instead-of-enrichment/)
- Other tools include Pathway-Express, SPIA, NetGSA, etc. (See Nguyen et al. 2019 for a review of PT methods.)
What tools are available?
This is neither a comprehensive list of tools nor an endorsement of certain tools, but rather a list of semi-popular tools with different approaches. Note: there are a ton of tools out there. Be aware of the background methods used and the quality of results returned.
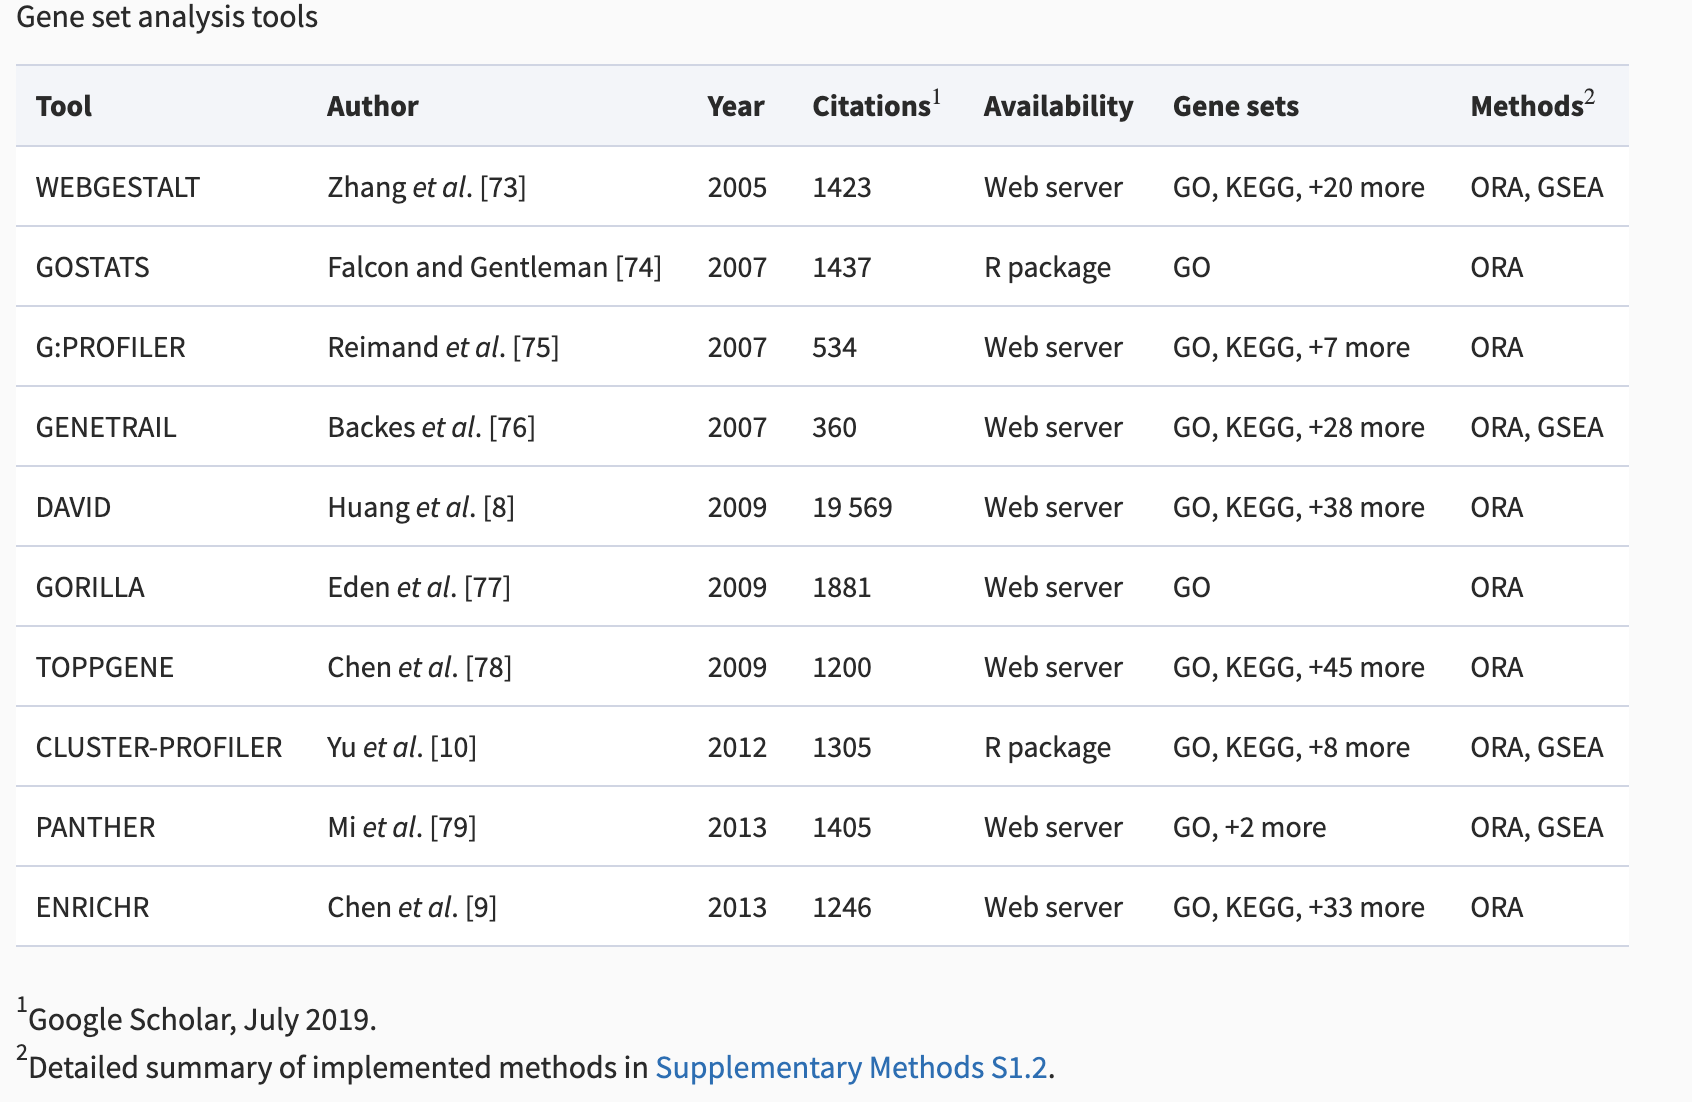
Table from Geistlinger et al. 2020
Other and related tools
- Gene Set Enrichment Analysis (GSEA)
- EnrichmentMap
- REVIGO (reducing and visualizing gene ontology)
- Pathview
- iPathwayGuide (proprietary)
- Qiagen IPA (proprietary, CCR license)
- Qlucore (proprietary, CCR license)
- GeneMANIA
- CellNetAnalyzer
- PARADIGM
Other databases
There are many databases devoted to relating genes and gene products to pathways, processes, and other phenomenon. Again, the following is not meant to be a comprehensive list.
Kyoto Encyclopedia of Genes and Genomes (KEGG)
- curated database
- biological pathways
- molecular interaction networks
- Very nice pathway maps
- Restricted licenses
The Reactome Knowledgebase systematically links human proteins to their molecular functions, providing a resource that functions both as an archive of biological processes and as a tool for discovering novel functional relationships in data such as gene expression studies or catalogs of somatic mutations in tumor cells. --- Jassal et al. 2019
- curated database including metabolism, signaling, and other biological processes
- human specific
- also includes disease superpathways
- built-in pathway analysis tool
- a meta-database of pathways from other pathway databases
- standardized format
The PANTHER (Protein ANalysis THrough Evolutionary Relationships) Classification System was designed to classify proteins (and their genes) in order to facilitate high-throughput analysis. The core of PANTHER is a comprehensive, annotated “library” of gene family phylogenetic trees. --- pantherdb.org/about.jsp
- database of signaling pathways
- community driven meta-database of pathways
The NDEx Project provides an open-source framework where scientists and organizations can store, share, manipulate, and publish biological network knowledge. - ndexbio.org
HumanCyc (See BioCyc)
HumanCyc provides an encyclopedic reference on human metabolic pathways, the human genome, and human metabolites. --- humancyc.org
- Looking for a specific database? Pathguide contains a resource list of pathways searchable by organism and resource type.
- Most recent update was 2017
Importance of Gene IDs
To use various tools for functional analysis, you will need a list of annotated genes. Gene annotations come in a variety of flavors and not all flavors are compatible with every tool. For example, Gene Ontology (GO) is associated with Entrez, Ensemble, and offical gene symbols (assigned by the HUGO Gene Nomenclature Committee (HGNC)).
Note: Genome builds will have differences in the names and coordinates of genomic features, which will impact gene ID conversions. See this tutorial from the Harvard Chan Bioinformatics Core.
Some tools to help with annotation / conversion:
- g:Convert
- Ensembl Biomart
- AnnotationHub
Resources:
- Functional enrichment and comparison with R .
- ClusterProfiler, pathview, and good introductory information
- Article on the impact of the evolving GO
- Ten Years of Pathway Analysis: Current Approaches and Outstanding Challenges, PLOS Computation Biology, 2012
- Pathway enrichment analysis and visualization of omics data using g:Profiler, GSEA, Cytoscape and EnrichmentMap
- Toward a gold standard for benchmarking gene set enrichment analysis, Briefings in Bioinformatics, 2021
- Enrichment analysis resource list from UCSF
- Introductory lectures on functional enrichment and R